Operator
Perform live operations against your environments.
Overview
Operator is an application that serves as an IDE (Integrated Development Environment) for Security Engineering and Offensive Engineering workflows. Tools, Ontology, and AI is at the user’s fingertips to conduct live operations against environments much faster and more effectively. The Operator workspace is comprised of a large graph canvas for running operations.
Setting up a new Operation
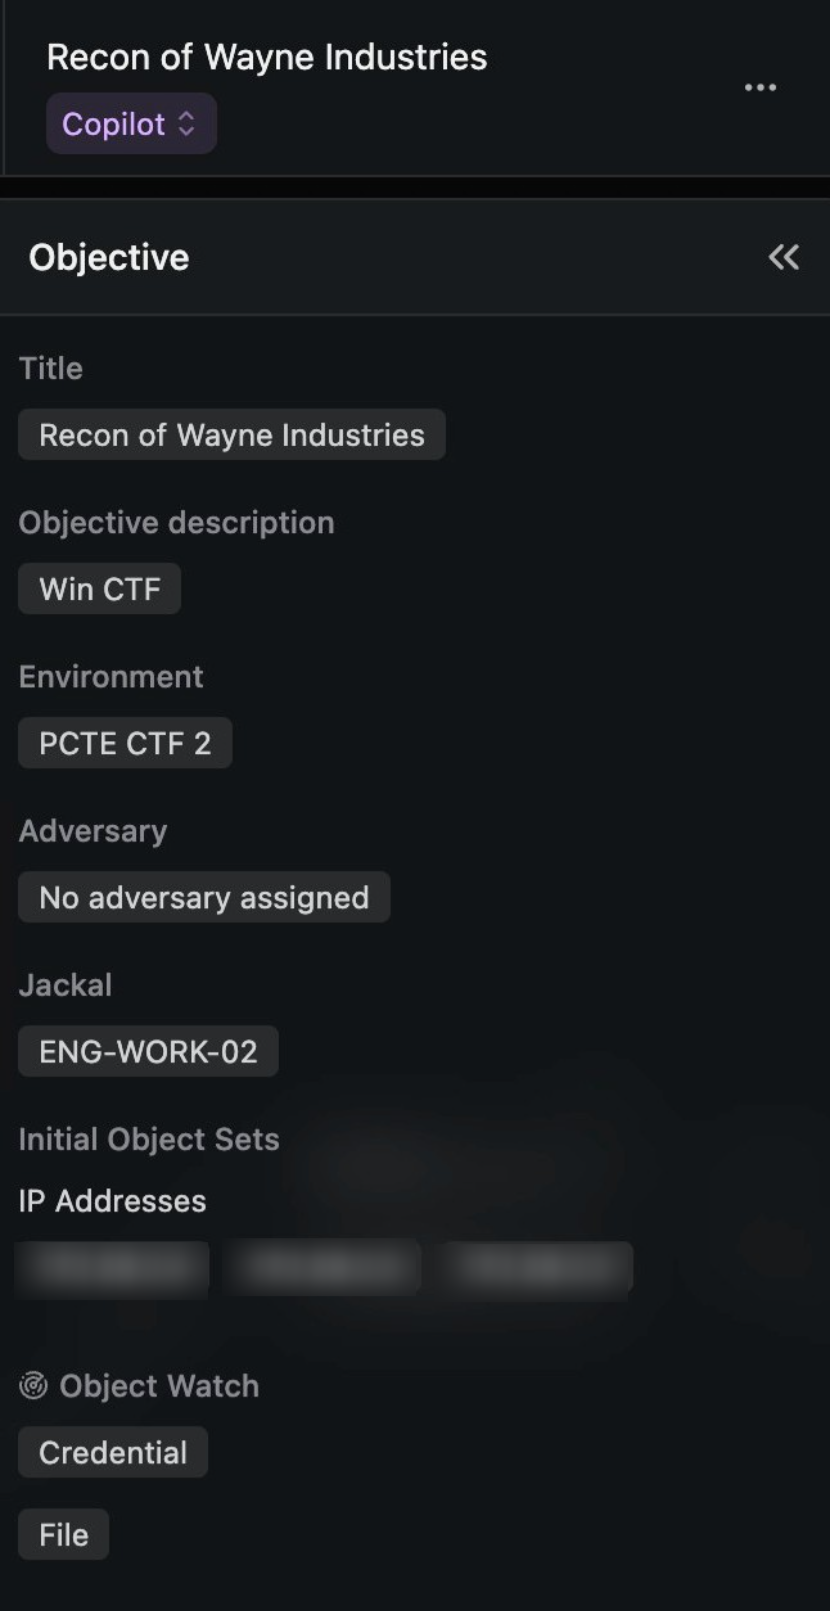
Set the Objective
The Objective tab lets you add a title, describe the objective, set the starting points and environment, and other optional parameters such as rules of engagement.
Adversary Emulation
With Reaper, you can create Adversary Profiles using PDFs of adversary intelligence. These can be added to your Operation as context for the AI for adversary emulation exercises.
Configure Rules of Engagement
You have the option to configure operational risk controls and set No Strike lists that enforce operational safety guardrails and limit what Tools can run on targets.
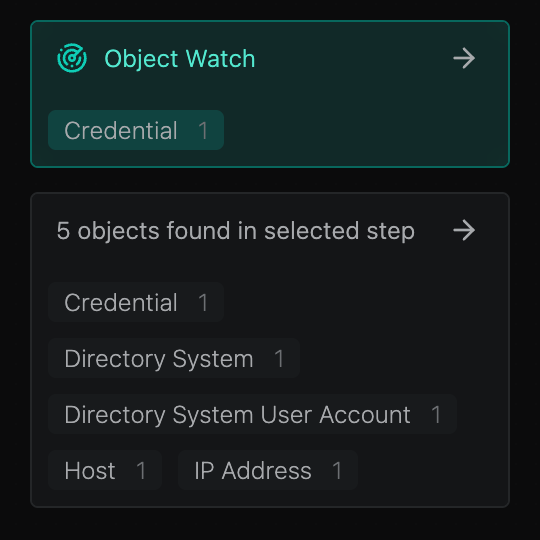
Watch an Object
Object Watch allows you to declare specific Object Types of interest. The system will passively watch for these Objects and alert you when Method discovers them in an operation.
You can revisit the operation objectives by clicking on the left pane in the workspace.
The left panel includes:
- Operation Cockpit
- Operation details
- Rules of Engagement (if configured)
- Supplemented Adversary Intelligence (if provided)
- Complete Tool Library
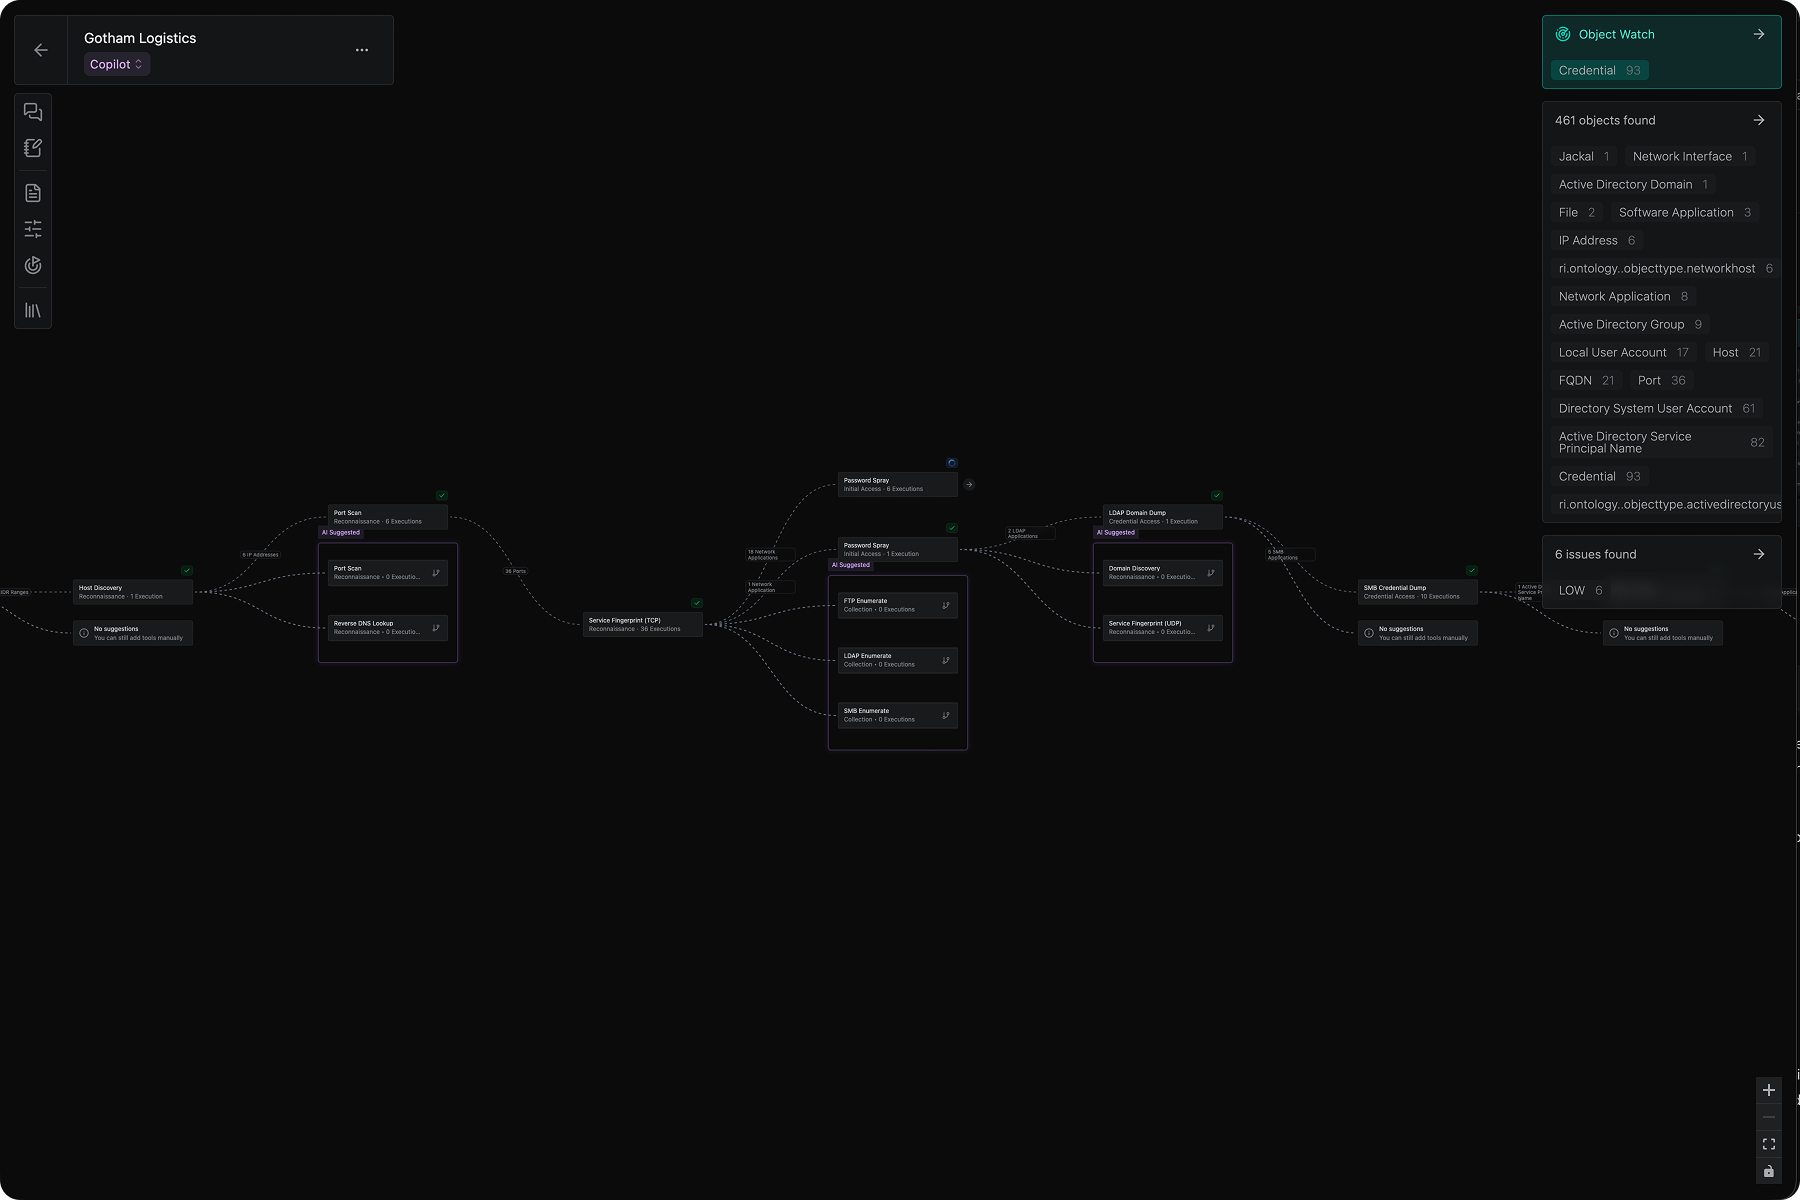
Navigate the Workspace
Throughout your operation, you can use the chat cockpit to ask questions about Issues, data collected, or what Tools to run next. Operator’s AI co-pilot has a deep understanding of security and of the Method Platform: the Tools, data, adversary profiles, and more that are contained therein.

The central graph shows you the steps taken in your operation so far. Nodes represent Tools that have run, and the edges between Tool nodes show the data types that are flowing through the operation.
The right panels show the Objects and Issues found in your operation. If a node is selected, you will only see the Objects and Issues found for that tool execution. If you de-select the node, you will see all of the objects found in the lineage of your operation.
Co-pilot Mode and Manual Mode
Operator offers two modes: Co-pilot mode and Manual mode.
Co-pilot mode is a human-in-the-loop, AI-assisted operating mode. When running in Co-pilot, you will receive AI-suggested tool recommendations based on the current mission objective, recent system findings, environmental context, and adversary intelligence. You can accept or decline these recommendations before tool execution.
Manual mode is a fully operator-driven operation, where there are no AI suggestions for tool executions. You can still chat with the AI in the Cockpit.
In the future, you will be able to operate in Auto mode, where the system will run completely autonomously within pre-defined guardrails set by the operator.
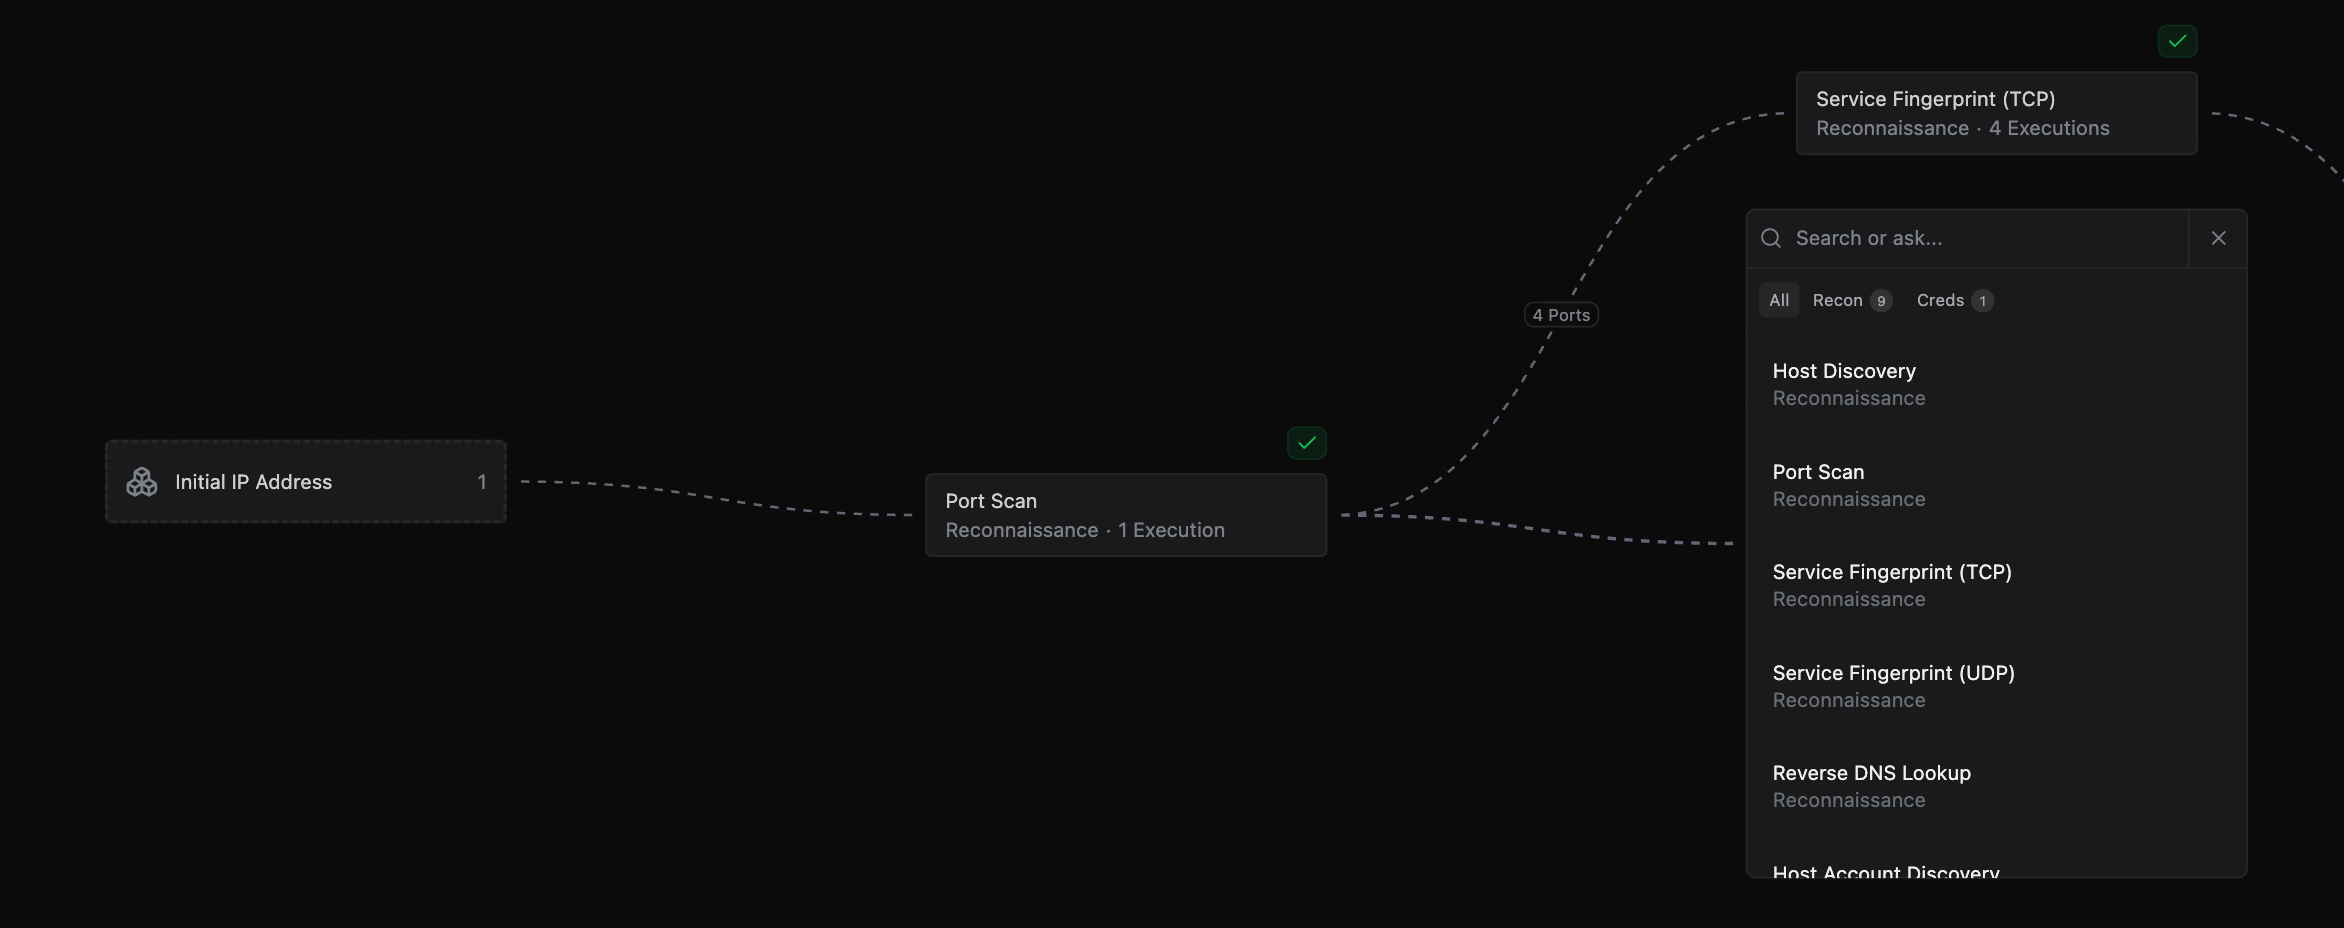
Utilize Method’s Tools
Operator has easy access to Method’s full suite of powerful tools. You can explore the tools in the Tool Library panel to learn about each. As you progress through your operation, only the tools that are applicable to the data you have discovered are suggested.
