Your first Operation
This guide will help you launch your first Operation for an internet-based investigation using resources maintained by Method Security. Operations can be investigative or offensive in nature; this guide focuses on an investigative workflow and walks you through the basic steps to get started.
Confirm Testing Environment is ready
We recommend creating a dedicated Environment for this and other tutorials to keep your tutorial data separate from production data.
See how to do so by following the Create an Environment guide.
Once created, navigate to the Reaper homepage.
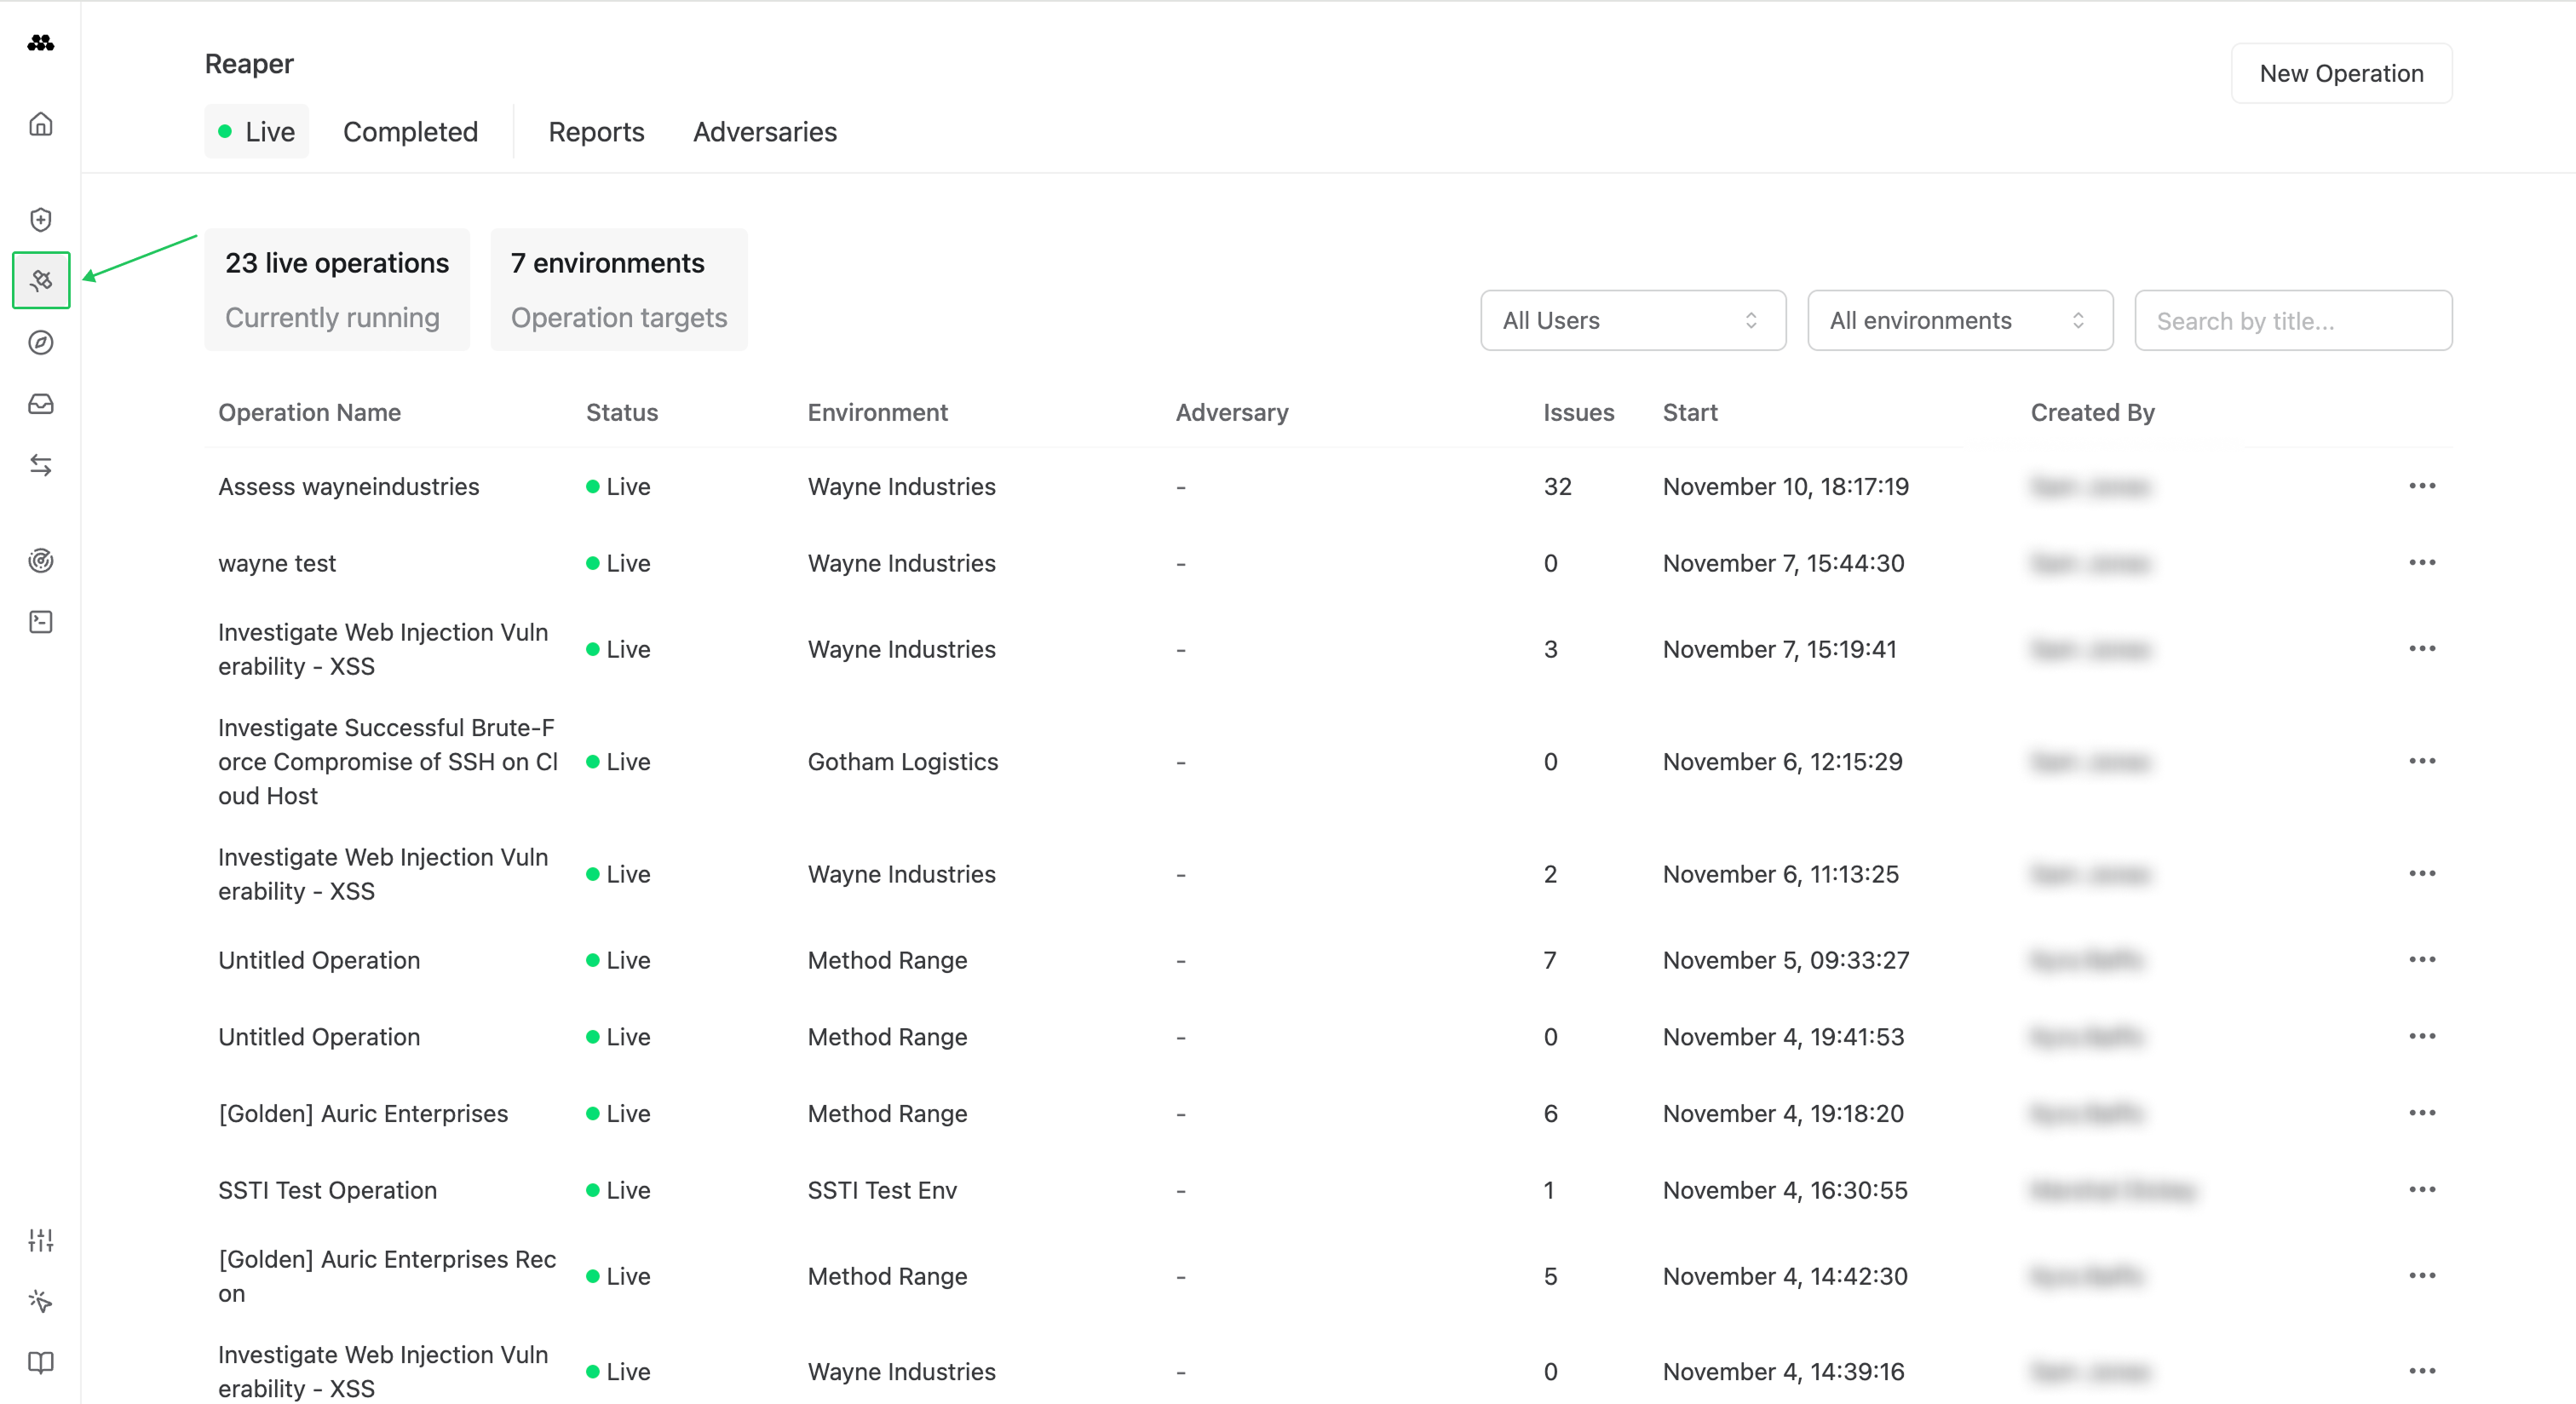
Begin the Operation
-
Select the New Operation button in the top-right corner of the screen.
-
A new operation will launch a new workspace.

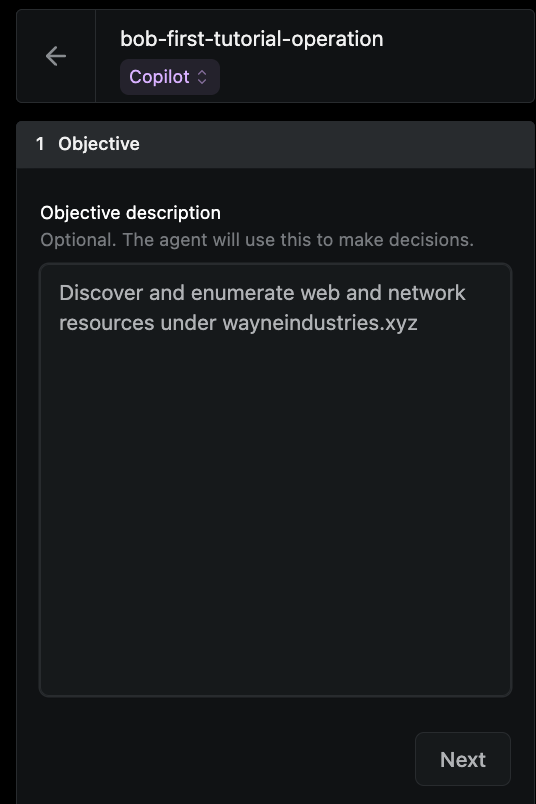
Setup the Operation
The following example depicts a internet-based reconnaissance and investigation operation of several web services:
- Name your Operation -
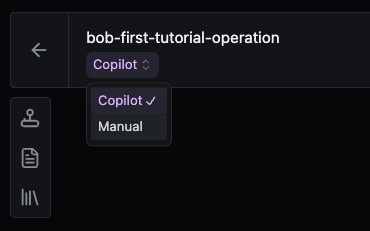
<yourname>-first-tutorial-operation - Select Copilot
- Provide a description Objective -
Discover and enumerate web and network resources under wayneindustries.xyz.
-
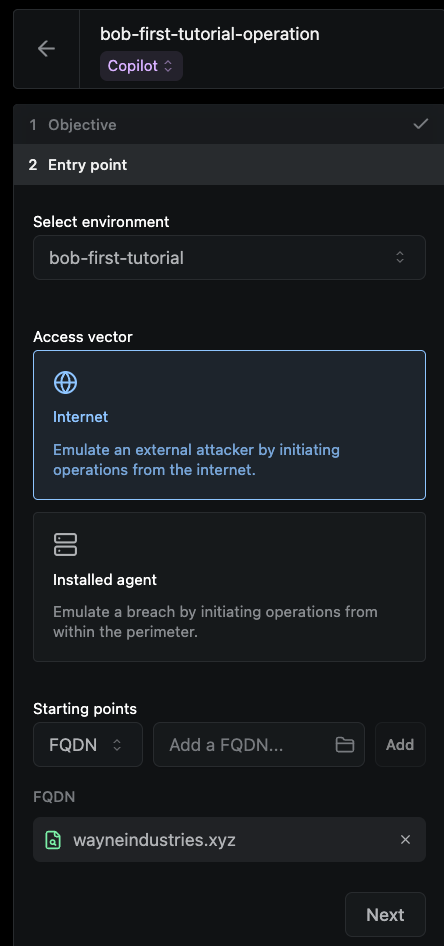
Specify the Entry point:
a. Environment -
<yourname>-first-tutorialb. Access vector – Internet c. Starting points - withFQDNselected, addwayneindustries.xyz
-
Skip Intelligence and Rules of engagement sections
-
Select Begin Operation
Execute
-
Run the Passive Subdomain Enumeration tool to enumerate
wayneindustries.xyz’s subdomains.a. Select Passive Subdomain Enumeration from the search box
b. Hit Run

- Confirm there are AI suggestions for next steps.
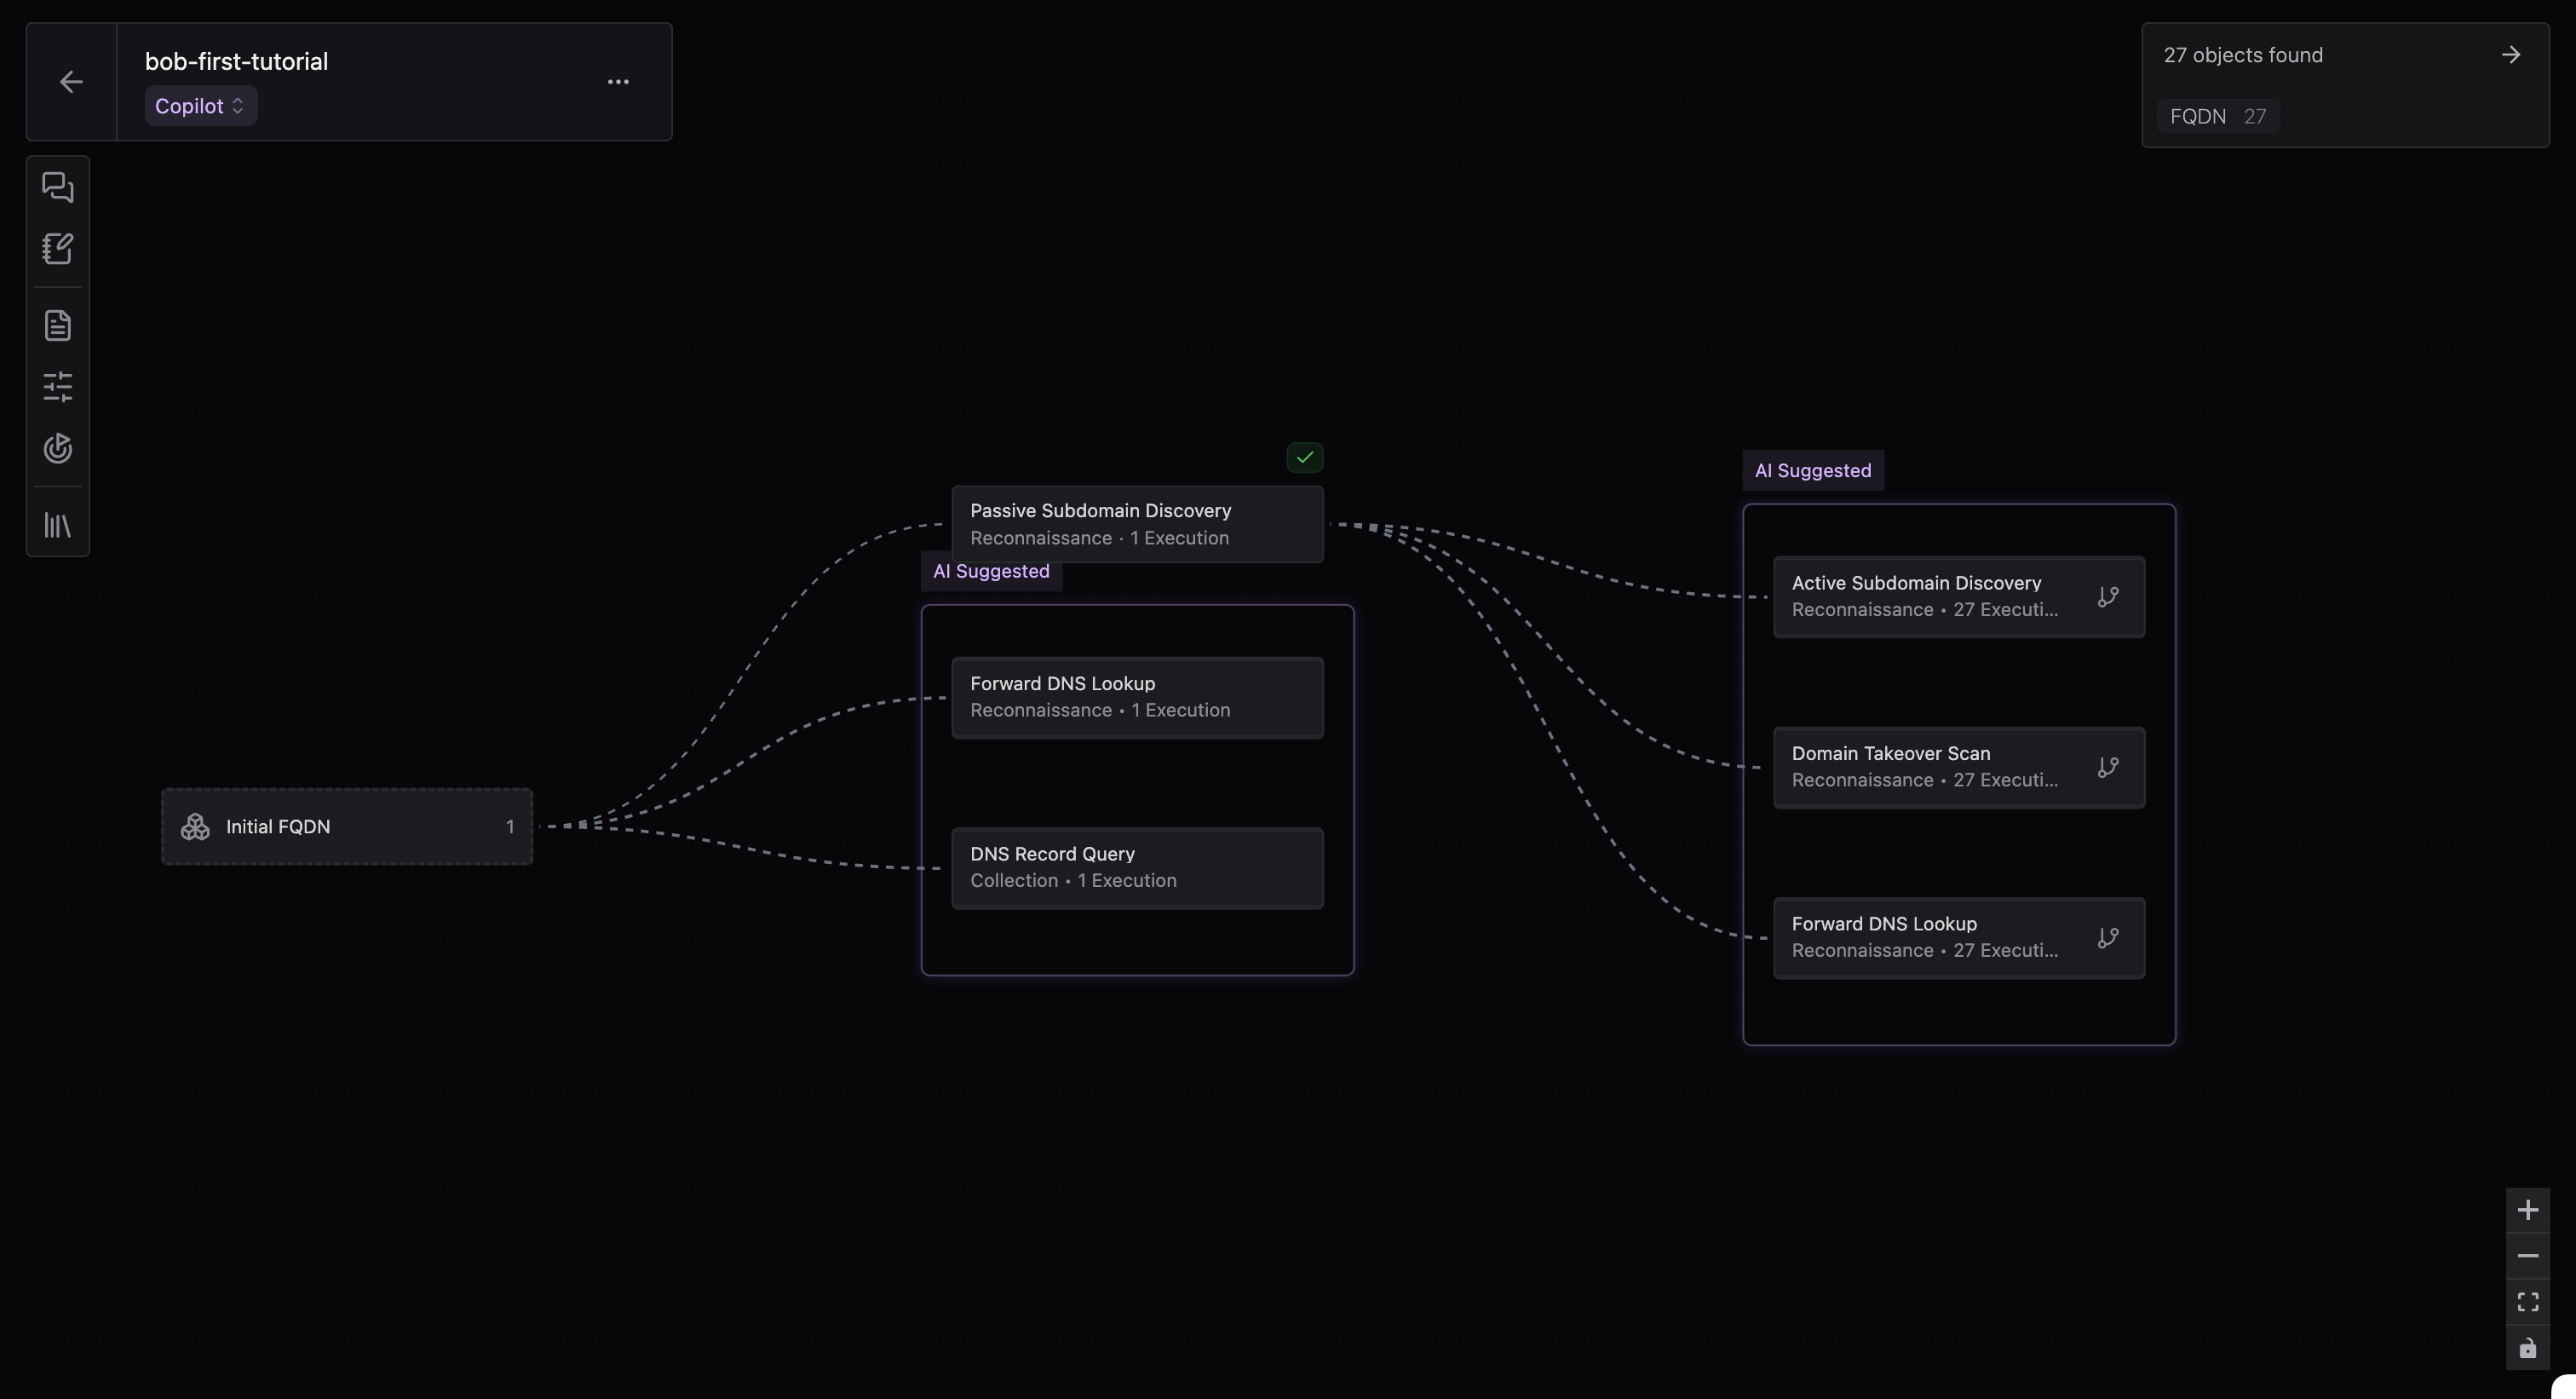
-
Accept and reject some AI suggestions on next steps:
a. If you see Port Scan as a next step, hit Run.
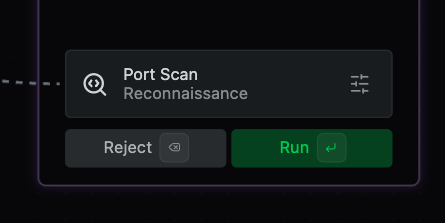
Accept Port Scan Step b. If you see Web Probe as a next step, hit Run.
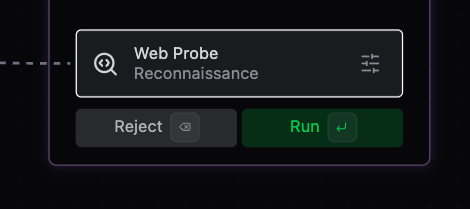
Accept Web Probe Step c. For all other steps recommended, hit Reject.
-
Next, change into Manual mode; this is to get a feel for not having the AI provide suggestions.
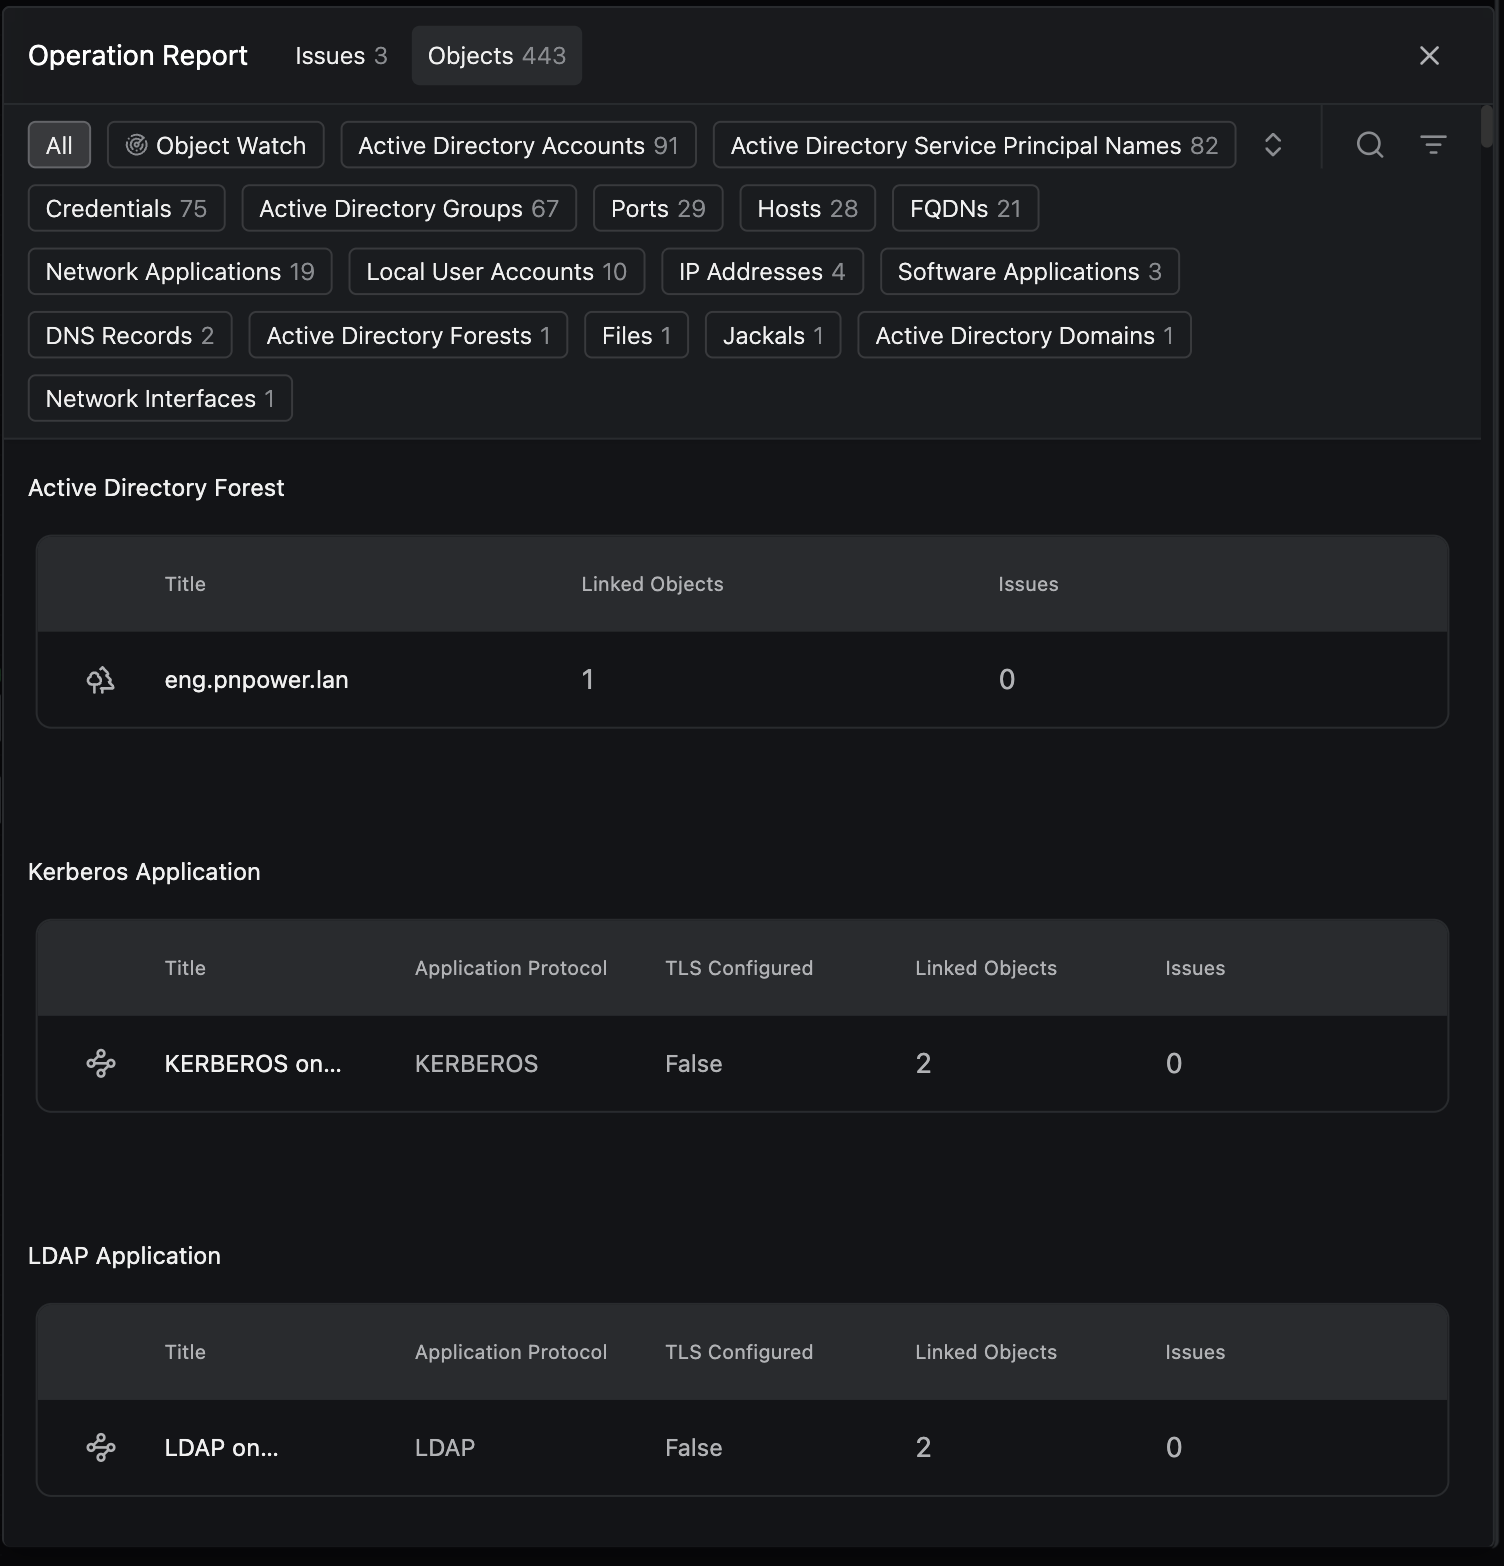
- Take a look at some data; click X objects found on the top-right to open up the Operation Report.
-
Fingerprint the services found after the Port Scan
a. After the Port Scan step, click the arrow and then select Choose next tool.

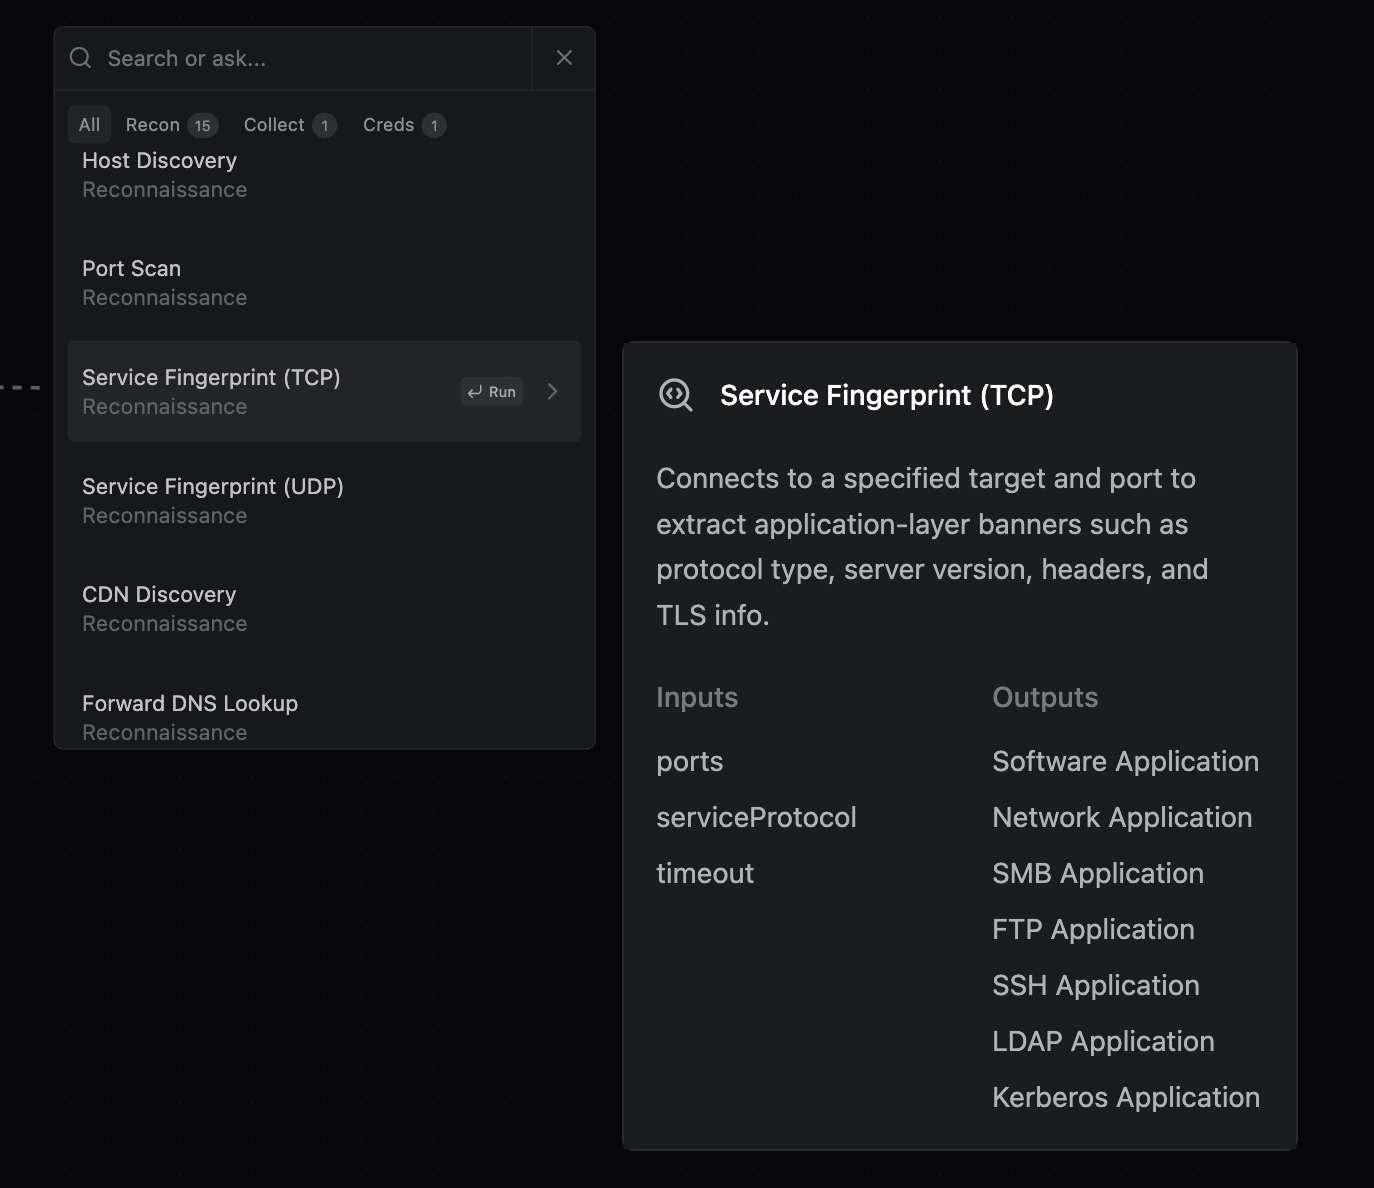
Tool after Port Scan b. Search for and select Service Fingerprint
Select Service Fingerprint c. Click and configure the execution; adjust Optional parameter - timeout to be 5, and hit Run.
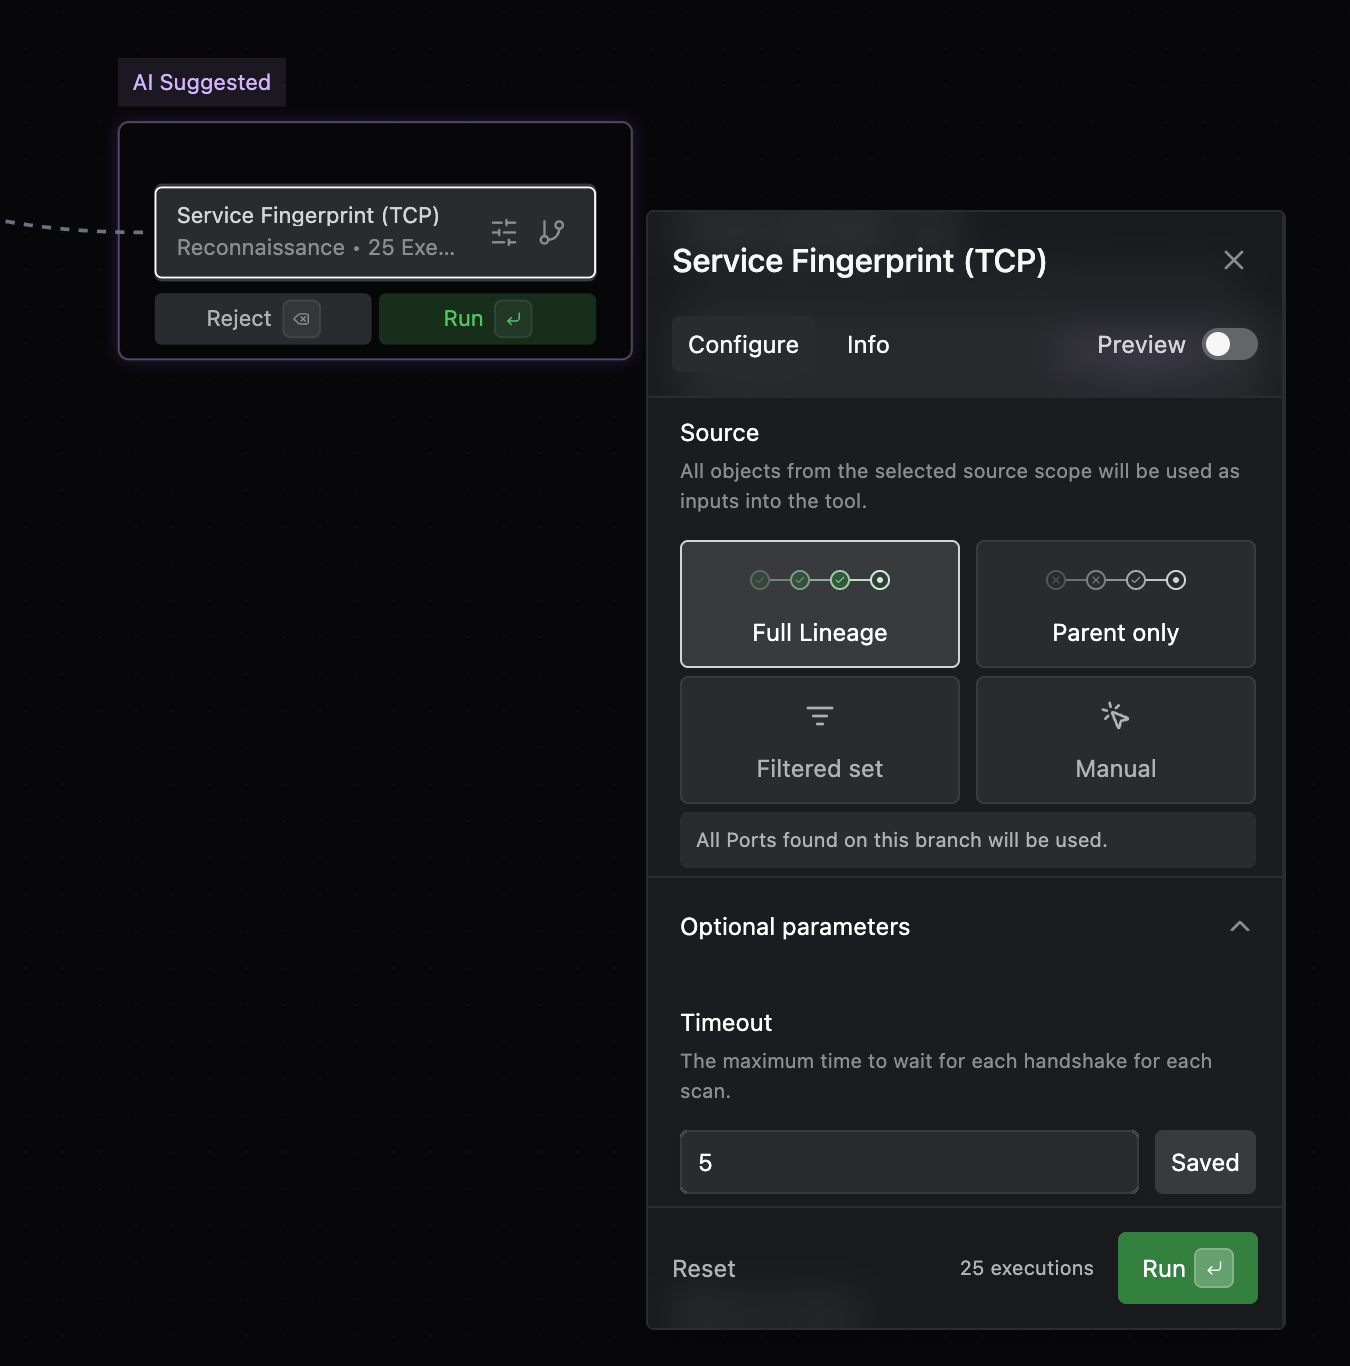
Configure Service Fingerprint -
Inspect the raw data and resulting Objects from Service fingerprint
a. Click on the Service Fingerprint node
b. Click on the Executions tab
c. For each execution, view both the Workflow Steps, Object Found, and Signal Output.
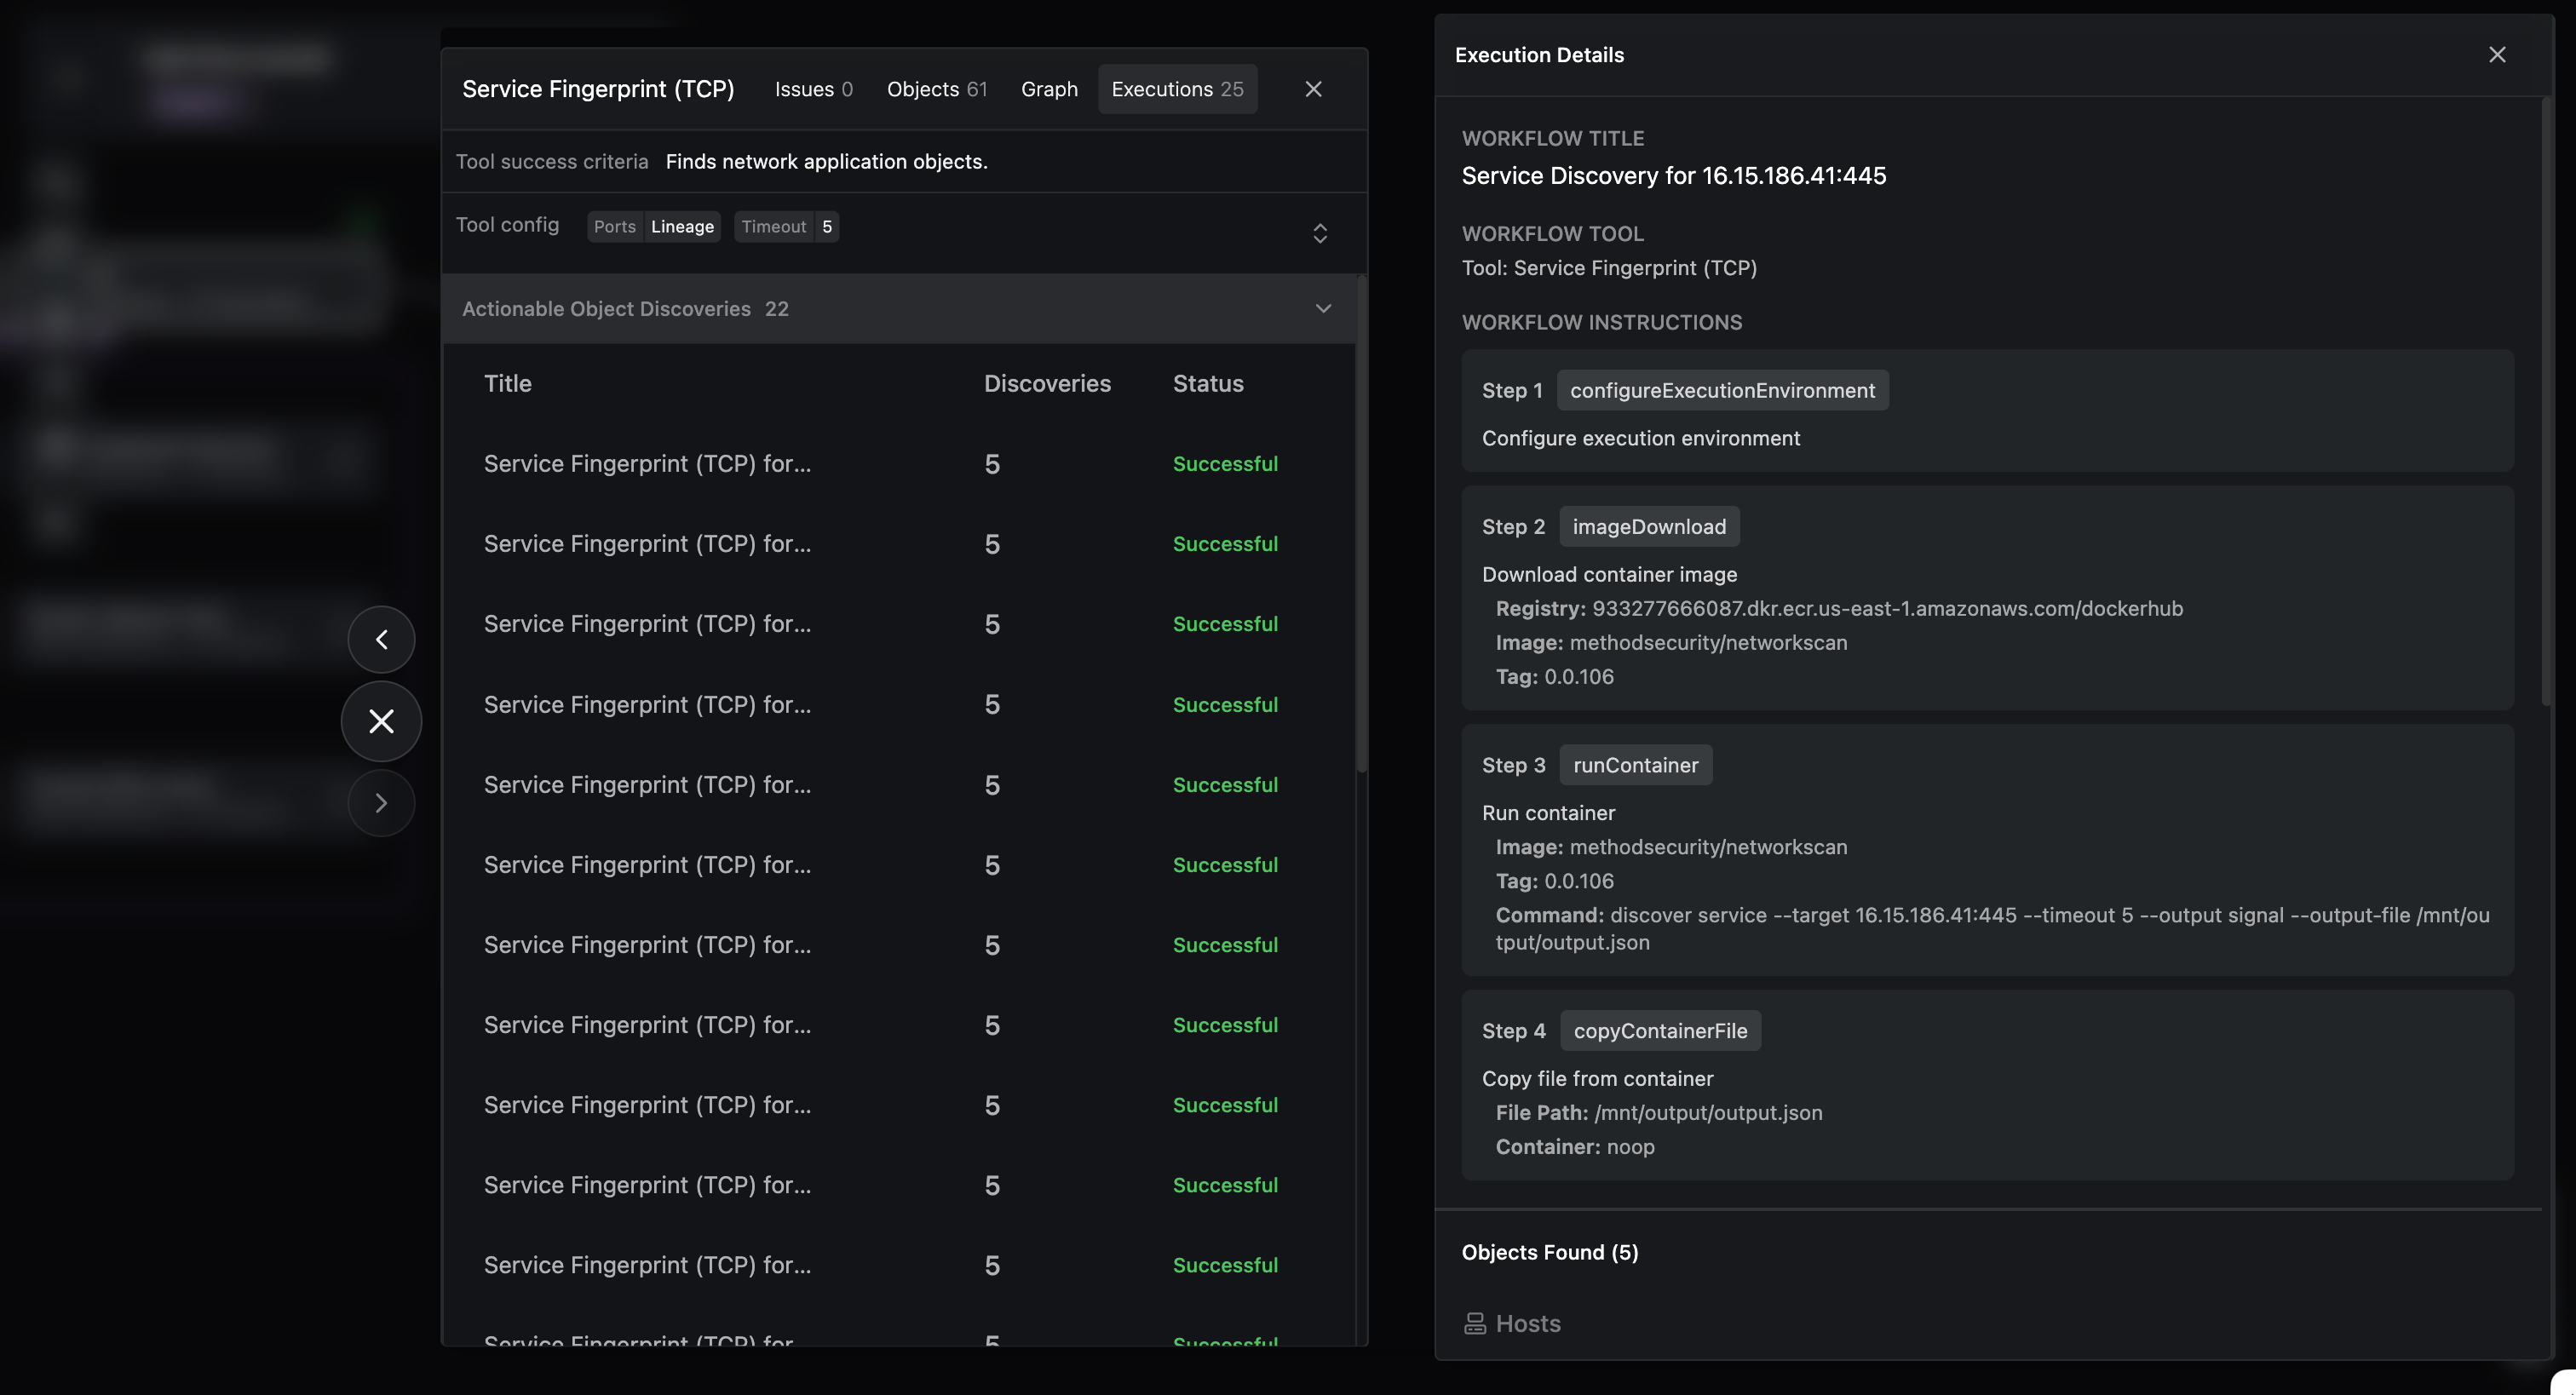
Service Fingerprint Step Inspection
Iterate
This was a simple, non-intrusive, tutorial to get you familiar with some of the functionality in Operator Mode. Continue the Operation against these cloud hosted resources, start a new one against new targets (e.g. new FQDN, IP, CIDR), or Deploy a Jackal and launch an Operation from an installed Access Vector.