

Developer
How developer-built capabilities connect to execution and data in the Method Platform.
Overview
Method provides extension points across the system so you can bring your existing security engineering investments into the platform:
- Tooling: Integrate custom Tools and the binaries or scripts they depend on.
- Jackals: Connect execution infrastructure for Access, Implants, and Job Runners.
- C2 (Command and Control): Use Method C2 or connect compatible custom C2 infrastructure.
These surfaces share the same platform contracts. Tools define work, Jackals execute it through C2, and Processors turn the resulting Signals into typed Ontology Objects. This lets custom capabilities participate in the same Operations and data model as Method-built capabilities.
The rest of this page shows where those developer surfaces connect to the platform, how the parts of a Tool interact with adjacent systems, and how you build, validate, and refine a Tool.
How the platform integrates developer extensions
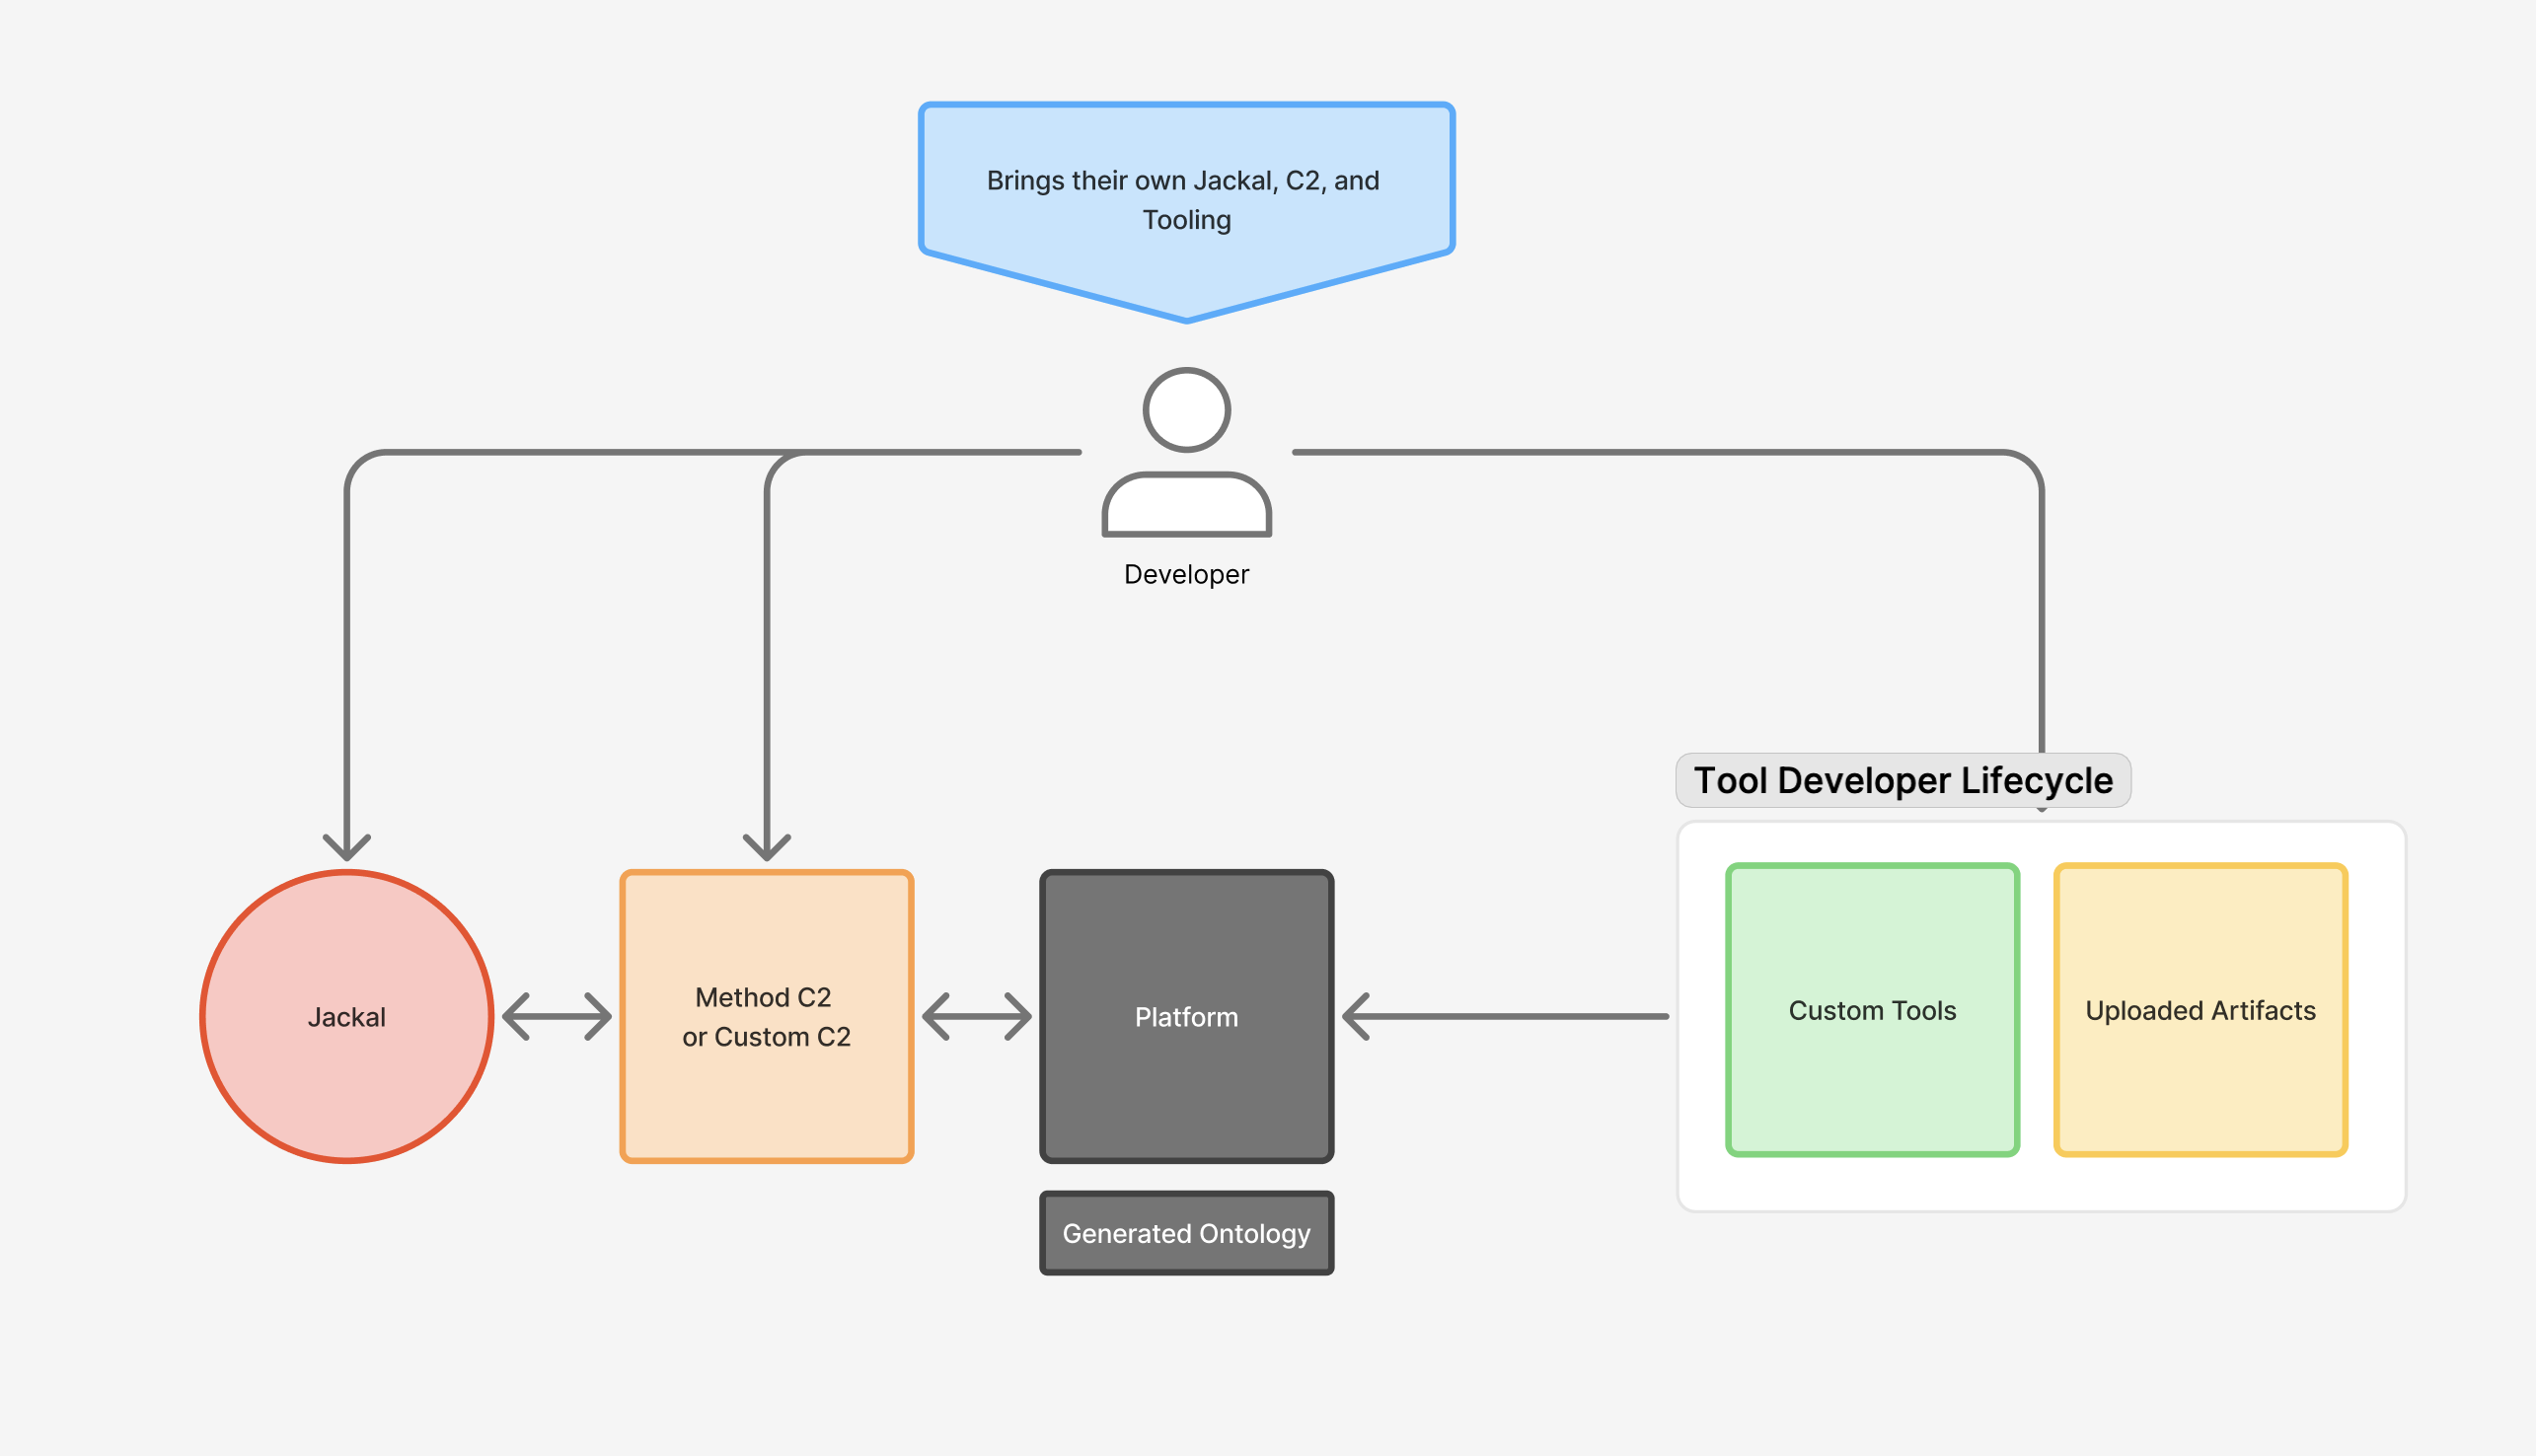
You can extend Method at three boundaries:
- Tools and artifacts: The Tool developer lifecycle brings custom Tools and uploaded artifacts into the platform. A Tool can use an artifact, such as a binary or script, when it needs executable content that is not already available on a Jackal.
- Jackals: Jackals provide the execution boundary. A developer-provided Jackal can support Access, Implant, or Job Runner use cases, then advertise the capabilities it makes available. The platform uses those capabilities to determine which work the Jackal can execute.
- C2: The C2 boundary connects the platform and Jackals. You can use Method C2 or implement compatible custom C2 infrastructure for environments that need a different transport or topology. In either case, work and results move bidirectionally between the platform and the Jackal. For more detail, see Jackal and the Courier Protocol.
Together, these boundaries preserve a consistent result: data generated by custom execution flows returns to the platform and becomes part of the Ontology.
A Tool and its adjacent surfaces
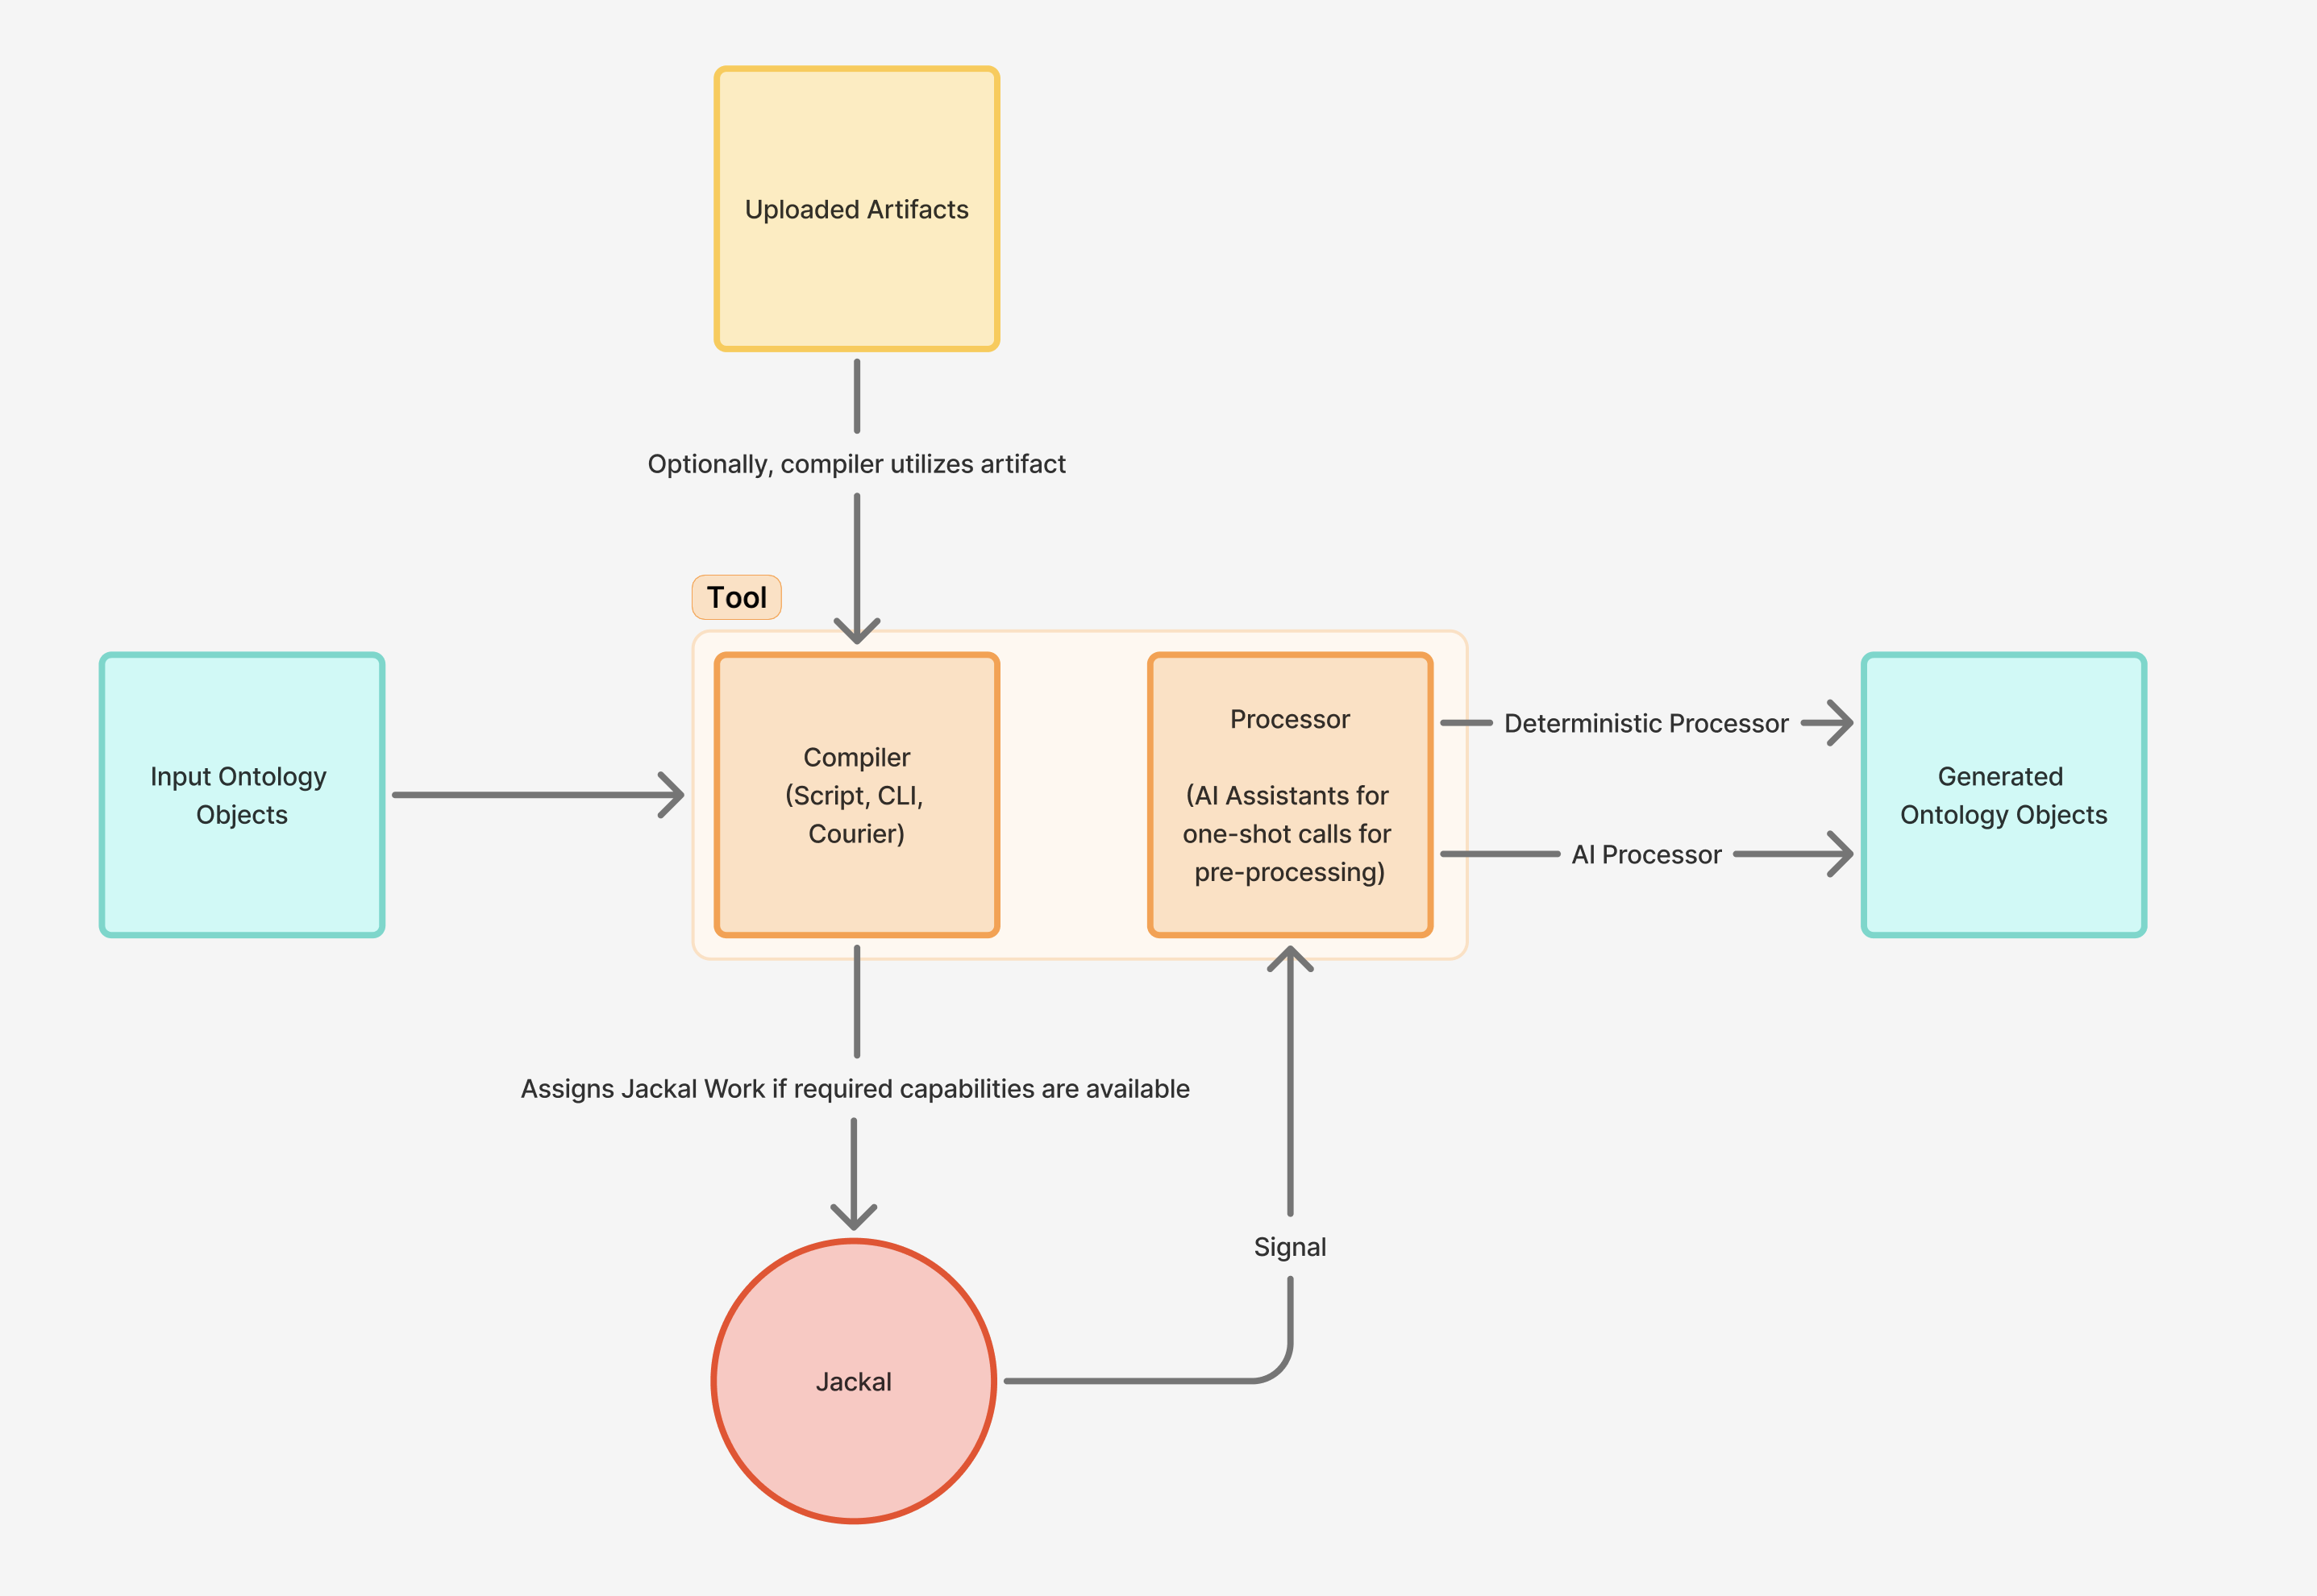
A Tool has two main components: a Compiler and a Processor. The Compiler turns selected Ontology Objects and typed parameters into work a Jackal can execute. Depending on the Tool, it produces a Script command, a CLI execution, or a Courier workflow. It can also reference an uploaded artifact when the work requires a stored binary or script.
Before assigning work, the platform checks that the selected Jackal advertises the capabilities the Tool requires. The Jackal executes the compiled work and returns its raw output as Signals.
The Processor transforms those Signals into generated Ontology Objects. It can map output deterministically or use AI assistance for bounded, one-shot preprocessing before creating typed Objects. Those Objects become durable platform data and can serve as inputs to later Tools and Operations.
This Compiler-to-Processor boundary keeps execution and interpretation separate. The Compiler defines what runs, while the Processor defines what the result means. See the Tool authoring reference for the contracts behind each component.
Tool development lifecycle
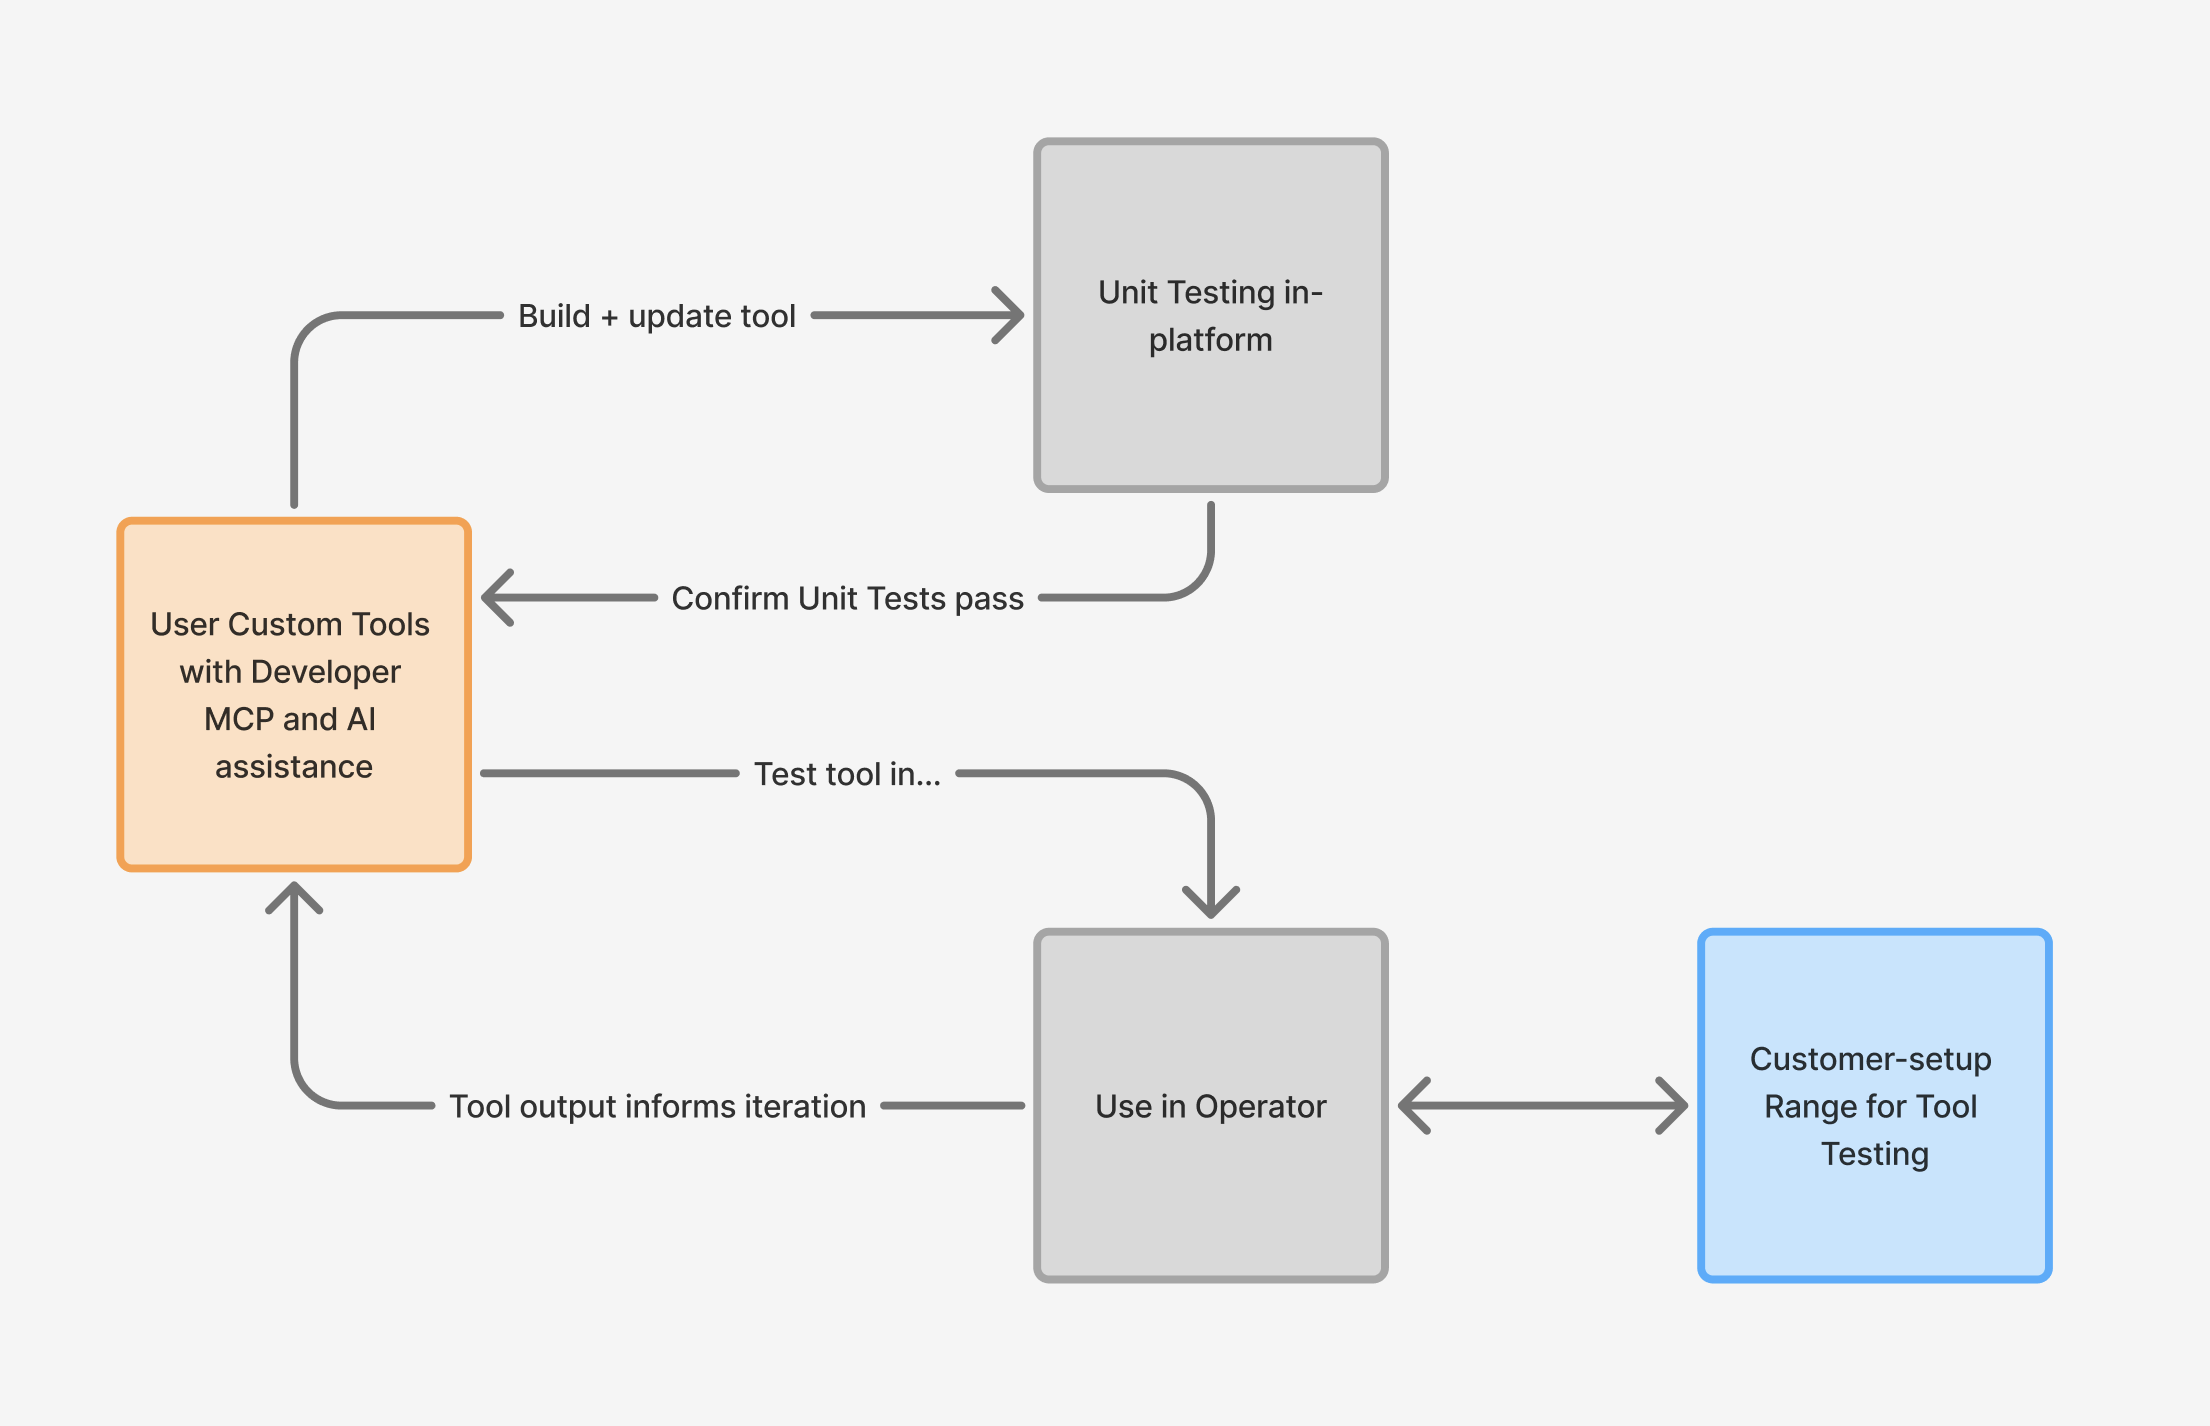
Tool developers can take advantage of testing and feedback loops provided by the platform. You can build or update a Tool in the platform’s Tool creation page, which includes AI assistance, or work from an external development environment through Method-hosted Developer MCP. Both paths use platform validation to confirm that the Tool definition, Compiler, and Processor behave as expected. Failed validation returns you to the Tool definition before any work reaches a target.
After validation passes, you can test the Tool in Operator. A customer-managed range provides a controlled target environment when one is available. The Tool’s output then informs the next development pass, creating a repeatable loop from implementation to realistic execution and back again.
Separating validation from operational testing catches contract errors early while still letting you observe how the Tool behaves in a representative environment. As the Tool changes, you repeat both loops so each version remains predictable before you use it against a live target.
To start integrating a Tool, see Operator-defined Tools. For the underlying Tool contracts, see the Tool authoring reference.