Operator-defined Tools
Operator-defined Tools
Operator-defined Tools are in closed alpha and being updated daily. If you want this feature enabled on your stack, please reach out to your Method representative.
While Method ships with a library of Method Tools you can use out of the box, most teams have tradecraft of their own that they have built and refined over years. Operator-defined Tools bring that tradecraft into the Method Platform.
When you integrate a Tool, you describe how Method runs it and how its output becomes structured data. From that point on, your Tool and Method’s built-in Tools are treated as equal citizens: both run in Operations, both feed the Ontology, and both can be suggested by Method’s AI.
Integrating your own Tool gives you:
- A custom Tool that runs anywhere Method Tools run: in Operations, in Overwatch sessions, and in Tasks.
- Tool output converted into typed Ontology Objects, so the data your Tool produces is reusable by every other part of the platform.
- AI suggestions that surface your Tool alongside Method Tools.
- A consistent and reviewable way to run proven techniques instead of relying on one operator’s terminal history.
Tools you integrate are versioned, classified, and validated the same way Method’s own Tools are.
Method open-sources its Tools on GitHub. You can see exactly how Method’s own Tools are built, and anyone has the option to contribute new tools or upgrades to these tools (pending Method Security Engineering approval).
How a Method Tool works
Integrating a Tool comes down to four jobs:
- Describe the Tool: its name, family, intent, risk level, and the Object Types it generates. Method uses this to display the Tool and recommend it correctly.
- Define its inputs: the parameters a user sets and the Objects a user selects when they run it.
- Compile execution: the Compiler defines how and where the Tool runs. It is either a shell command that runs inline on a deployed Jackal or a CLI binary executed on one.
- Process output: the Processor turns the Tool’s raw output into typed Objects in the Method Ontology, so its results are usable by the rest of the platform.
The Compiler and Processor are the two parts you build and validate in the Create Tool flow. Your Tool is ready to register once both are defined and validated. For the full definition structure, parameter types, and worked examples, see the Tool authoring reference.
Learn the lifecycle with a simple Tool
The next section contains detailed instructions on integrating your first Tool. The fastest way to get comfortable with Operator-defined Tools is to take a trivial one through its whole lifecycle before you build anything real. For example, a Tool that runs hostname on a Jackal and creates a single Host Object is enough to get a feel for the workflow.
- Create it. Build a no-parameter Shell Script Tool with one command and a Processor that creates one Object, then register it.
- Run it. Start an Operation, select your Tool from the Tool Library, and run it. Confirm the Object it produces appears in the Ontology.
- Modify it. Change the command or add a parameter and save. Method records this as a new version and leaves the previous one intact.
- Run it again. Run the new version in the same Operation and confirm the change took effect.
- Disable it. Disable the Tool from the Tools app, then return to the Operation and confirm it no longer appears in the Tool Library to run.
Once this loop feels routine, building a real Tool is the same process with more substantial commands and Objects.
Setup
We recommend following the workflow instructions below and referencing Tool authoring reference for technical details.
Open the Tool creation form
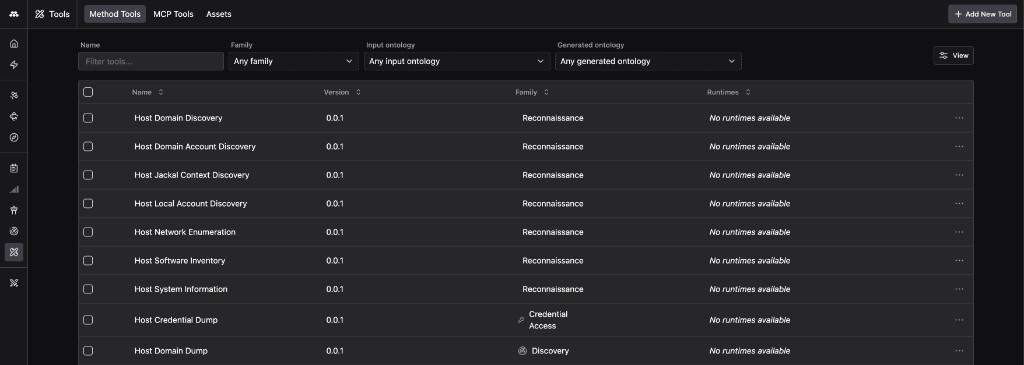
Open the Start something new menu and select Integrate Tool, or go to the Tools app and click Add New Tool.
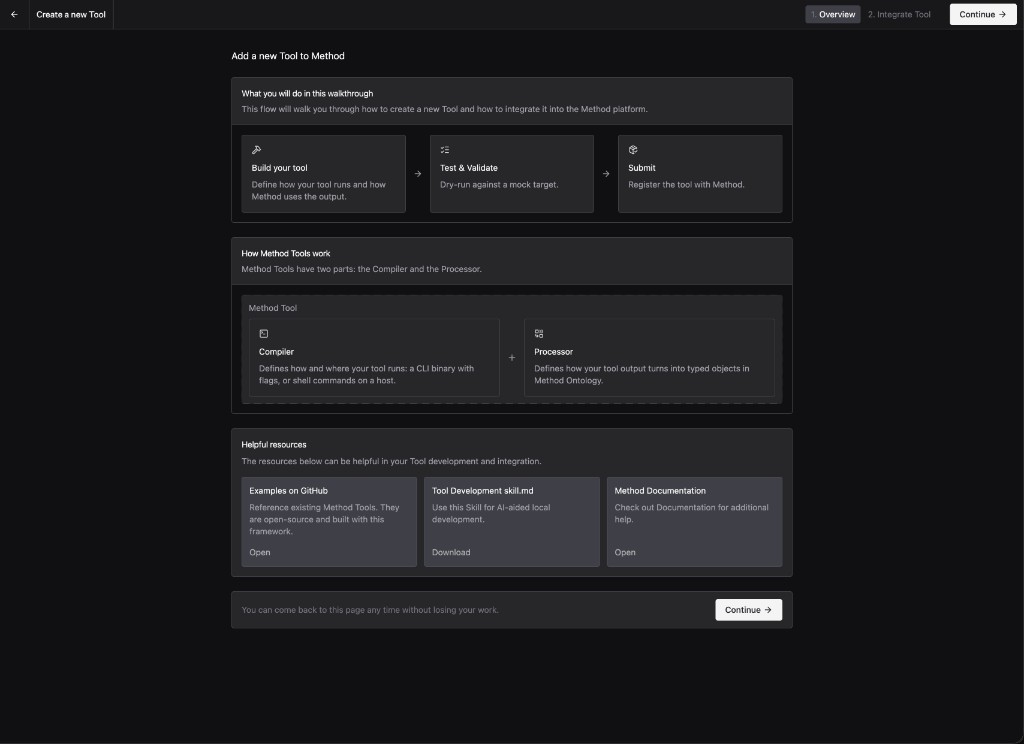
The Overview screen explains the integration flow: you add your Compiler and Processor details, validate them against mock data, then submit to register the Tool with Method. You can leave and return to a draft at any time without losing work.
Integrate the Compiler
Before you start, get one command working by hand and capture a real sample of its output. Knowing exactly what your Tool prints, and which Objects that output proves, makes both the Compiler and the Processor straightforward to write and validate.
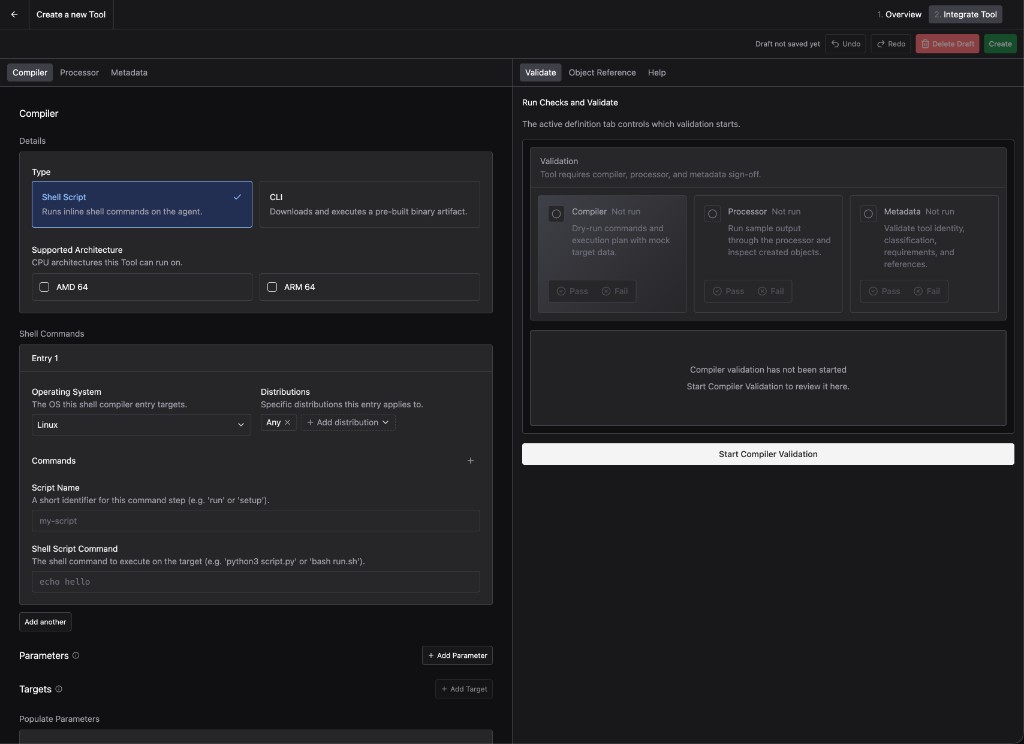
The Compiler is where you tell Method how to run your Tool. Choose a type:
- Shell Script: runs inline shell commands on a deployed Jackal. Use this for lightweight commands or to invoke a Tool already present on the Jackal.
- CLI: downloads and executes a pre-built binary on the Jackal. The binary can come from the Method artifact service, an external URL, or a path where the Tool is already installed.
Set the supported operating systems, distributions, and CPU architectures the Tool runs on, then define its commands, parameters, and targets:
- Parameters are the inputs a user sets when they run the Tool. Direct parameters are values the user types, such as a timeout or a domain. Ontology parameters are existing Method Objects the user selects, which Method resolves into target strings for your command.
- Targets tie an Ontology parameter to your command so the Tool runs once per selected Object. Select three IP Address Objects, and a target-aware Tool runs three times, once against each.
Validate the Compiler
To be able to integrate a tool with Method, you must run tests to validate that your integrated components work as expected. Open the Validate panel and start Compiler validation. Method dry-runs your commands and execution plan against mock target data, so you can confirm the Tool resolves and runs as intended without touching a live target.
Integrate the Processor
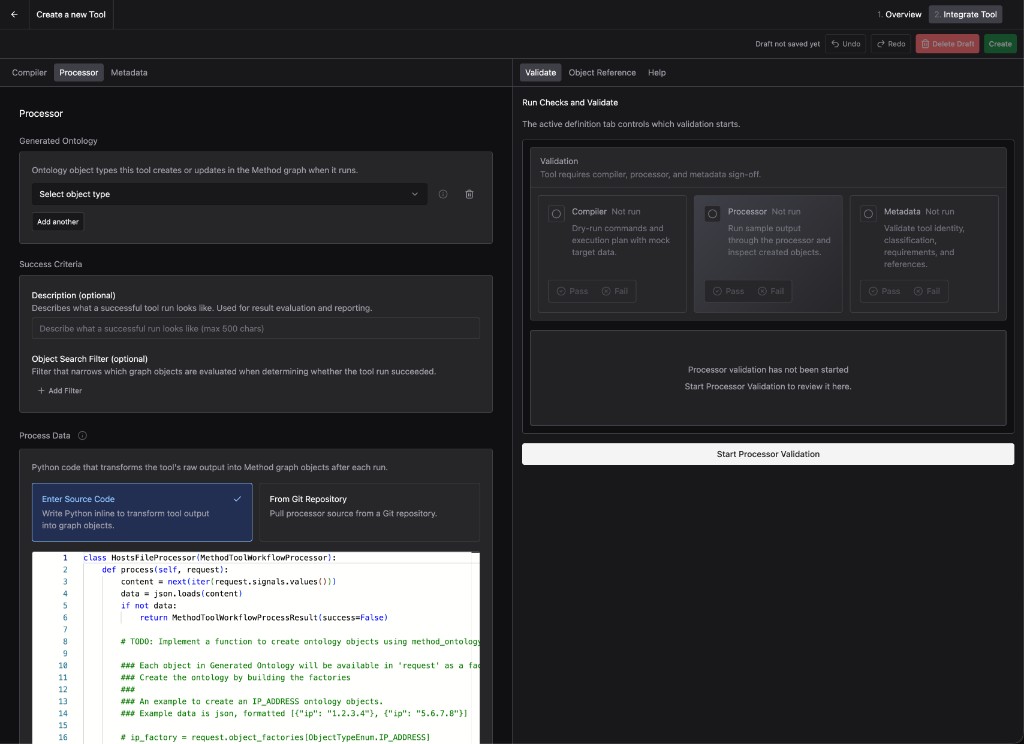
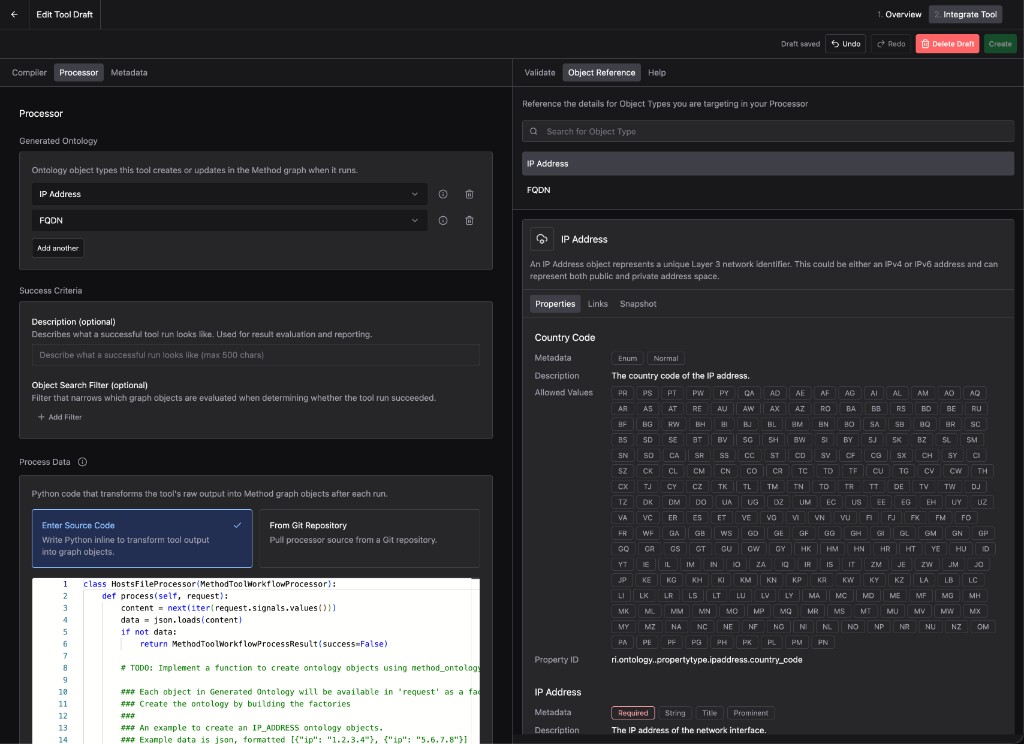
The Processor turns your Tool’s raw output into Method Objects. Declare the Ontology Object Types the Tool generates, then write the Python that maps raw output onto those Objects.
Method provides two processor shapes. A signal processor reads a single output, such as one JSON report from a CLI Tool. A workflow processor reads a map of named outputs, one per command, which fits multi-step shell scripts. Pick the one that matches how your Tool emits results.
You can also set success criteria: an Object filter that should match an Object a successful run creates. Keep it aligned with what your Processor actually builds, so a run that reports success always leaves a matching Object behind.
To write the Processor, you need to know the Object Types you are targeting. The Object Reference tab documents the properties, links, and snapshot for every Object Type in the Ontology, so you can map output to the right fields without leaving the builder.
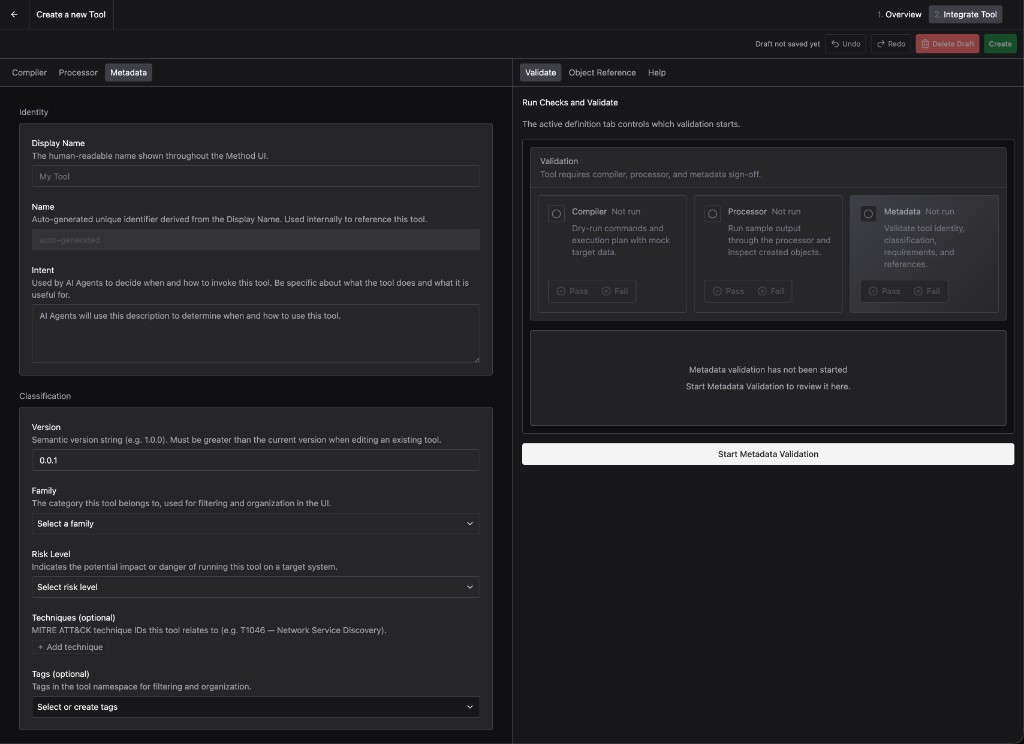
Add metadata and register
Fill out the Metadata tab to register the Tool. The Identity fields set the display name and the Intent, the description Method’s AI Agents read to decide when and how to invoke your Tool. The Classification fields set the version, family, risk level, optional MITRE ATT&CK techniques, and tags.
Set the risk level honestly. Use High for anything that authenticates, changes a system, exploits, exfiltrates, or establishes persistence. Adding Examples here also helps: each one pairs an objective with sample parameters, which teaches Method’s AI when and how to reach for your Tool.
Validate the Metadata, confirm all three checks have passed, and click Create. Your Tool is now registered and ready to run.
Day-to-day usage
Once your Tool is registered, it behaves like any other Method Tool.
- Run it in Operations. Operators can select your Tool from the Tool Library during an Operation in Operator, or while recording an Overwatch session.
- Schedule it in Tasks. Add your Tool to a Task to run it automatically on a cadence, the same way Method’s built-in Tools are scheduled.
- Let it feed the Ontology. Every run creates or updates the Object Types you declared in the Processor, so findings from your Tool flow into the same graph that powers the rest of the platform.
- See it in AI suggestions. Method’s AI Agents in Operator and Overwatch recommend your Tool alongside Method Tools, using the Intent and classification you provided. See Operator AI for how suggestions are grounded.
Your Tool and Method’s Tools share the same registry, execution model, and AI surface, so operators work with both the same way.
Next steps
The full definition structure: fields, parameter types, compilers, processors, validation, and worked examples.
See how Tools are organized and how they feed the Ontology.
The next stage of the Developer maturity ladder. Use custom Tools as building blocks for enterprise-specific Agents.