Operator Augmentation
This is the first stage of the Offensive Operations maturity ladder. It augments Operators with Method Agents and live analysis in active engagements using Overwatch. Operators continue to work in their own shell with their own tooling, while a set of Agents follows the same session inside the Method Platform.
Running engagements through Overwatch will give you:
- A live Timeline of every command and its full output, mirrored from the Operator’s terminal into the Platform.
- Object Findings extracted from command output and reviewed against the existing Ontology, so credentials, hosts, services, and other infrastructure become persistent Objects available to Operators, Method AI Agents, and future Operations or Tool use.
- Overwatch Chat for deeper reasoning, Ontology comparison, and Report drafting.
- A Report drafted from the session’s starred commands, accepted Objects, and your notes.
Setup
Below is how to install the Overwatch CLI and start your first session.
Install the Overwatch CLI and authenticate
Download the binary, run the setup wizard, install shell hooks, and authenticate by following Run an Overwatch session. The guide covers macOS, Linux, and Windows binaries; zsh, bash, and PowerShell hooks; troubleshooting; and the first overwatch record authentication flow.
Start a session
- From the Platform: Open Reaper, click New > Overwatch session, name the session, select an Environment, and click Create Session. Method generates a Session ID for the Operator to select on their next
overwatch record. - From an existing Operation: When terminal work should remain attached to an Operation’s objectives, targets, findings, and Report, start the Overwatch session from inside that Operation. Captured commands flow into the same Operation rather than a standalone session.
- From the terminal: Run
overwatch recordand pick the Session ID from the prompt.
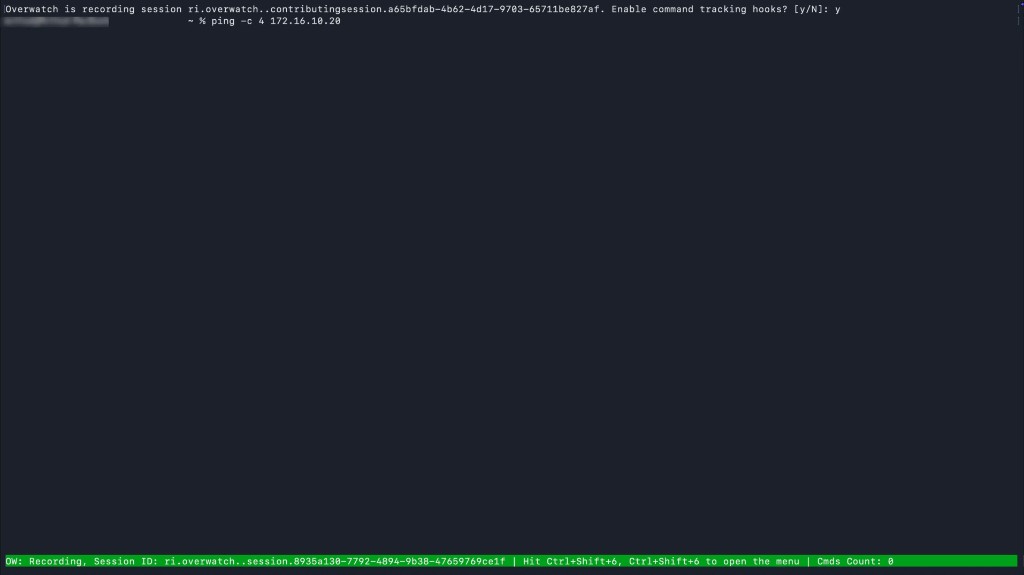
Once recording is active, a green status bar pins to the bottom of the terminal for the duration of the session. The bar shows the Session ID, the hotkey to open the Overwatch menu, and a running command count. The bar turns yellow if the session is paused.
Configure session Agents
Every Overwatch session comes with a set of Method AI Agents that collaborate inside the Operation. Each Agent has its own toggle, grouped by what it contributes during the engagement.
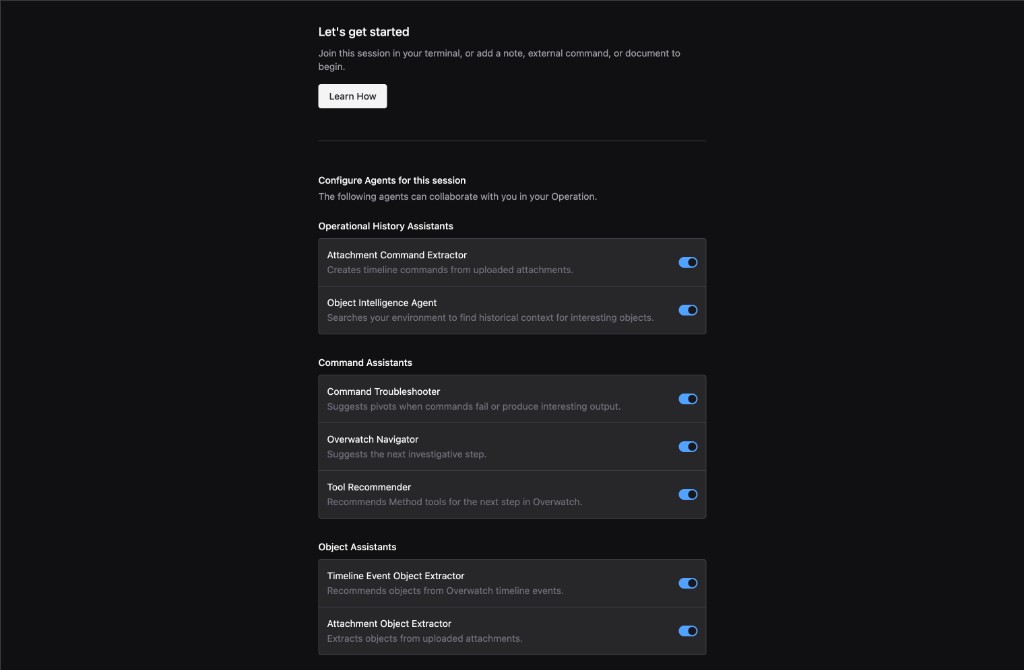
Operational History Assistants
- Attachment Command Extractor: creates Timeline commands from uploaded attachments.
- Object Intelligence Agent: searches your environment for historical context on interesting Objects.
Command Assistants
- Command Troubleshooter: suggests pivots when commands fail or produce interesting output.
- Overwatch Navigator: suggests the next investigative step.
- Tool Recommender: recommends Method Tools for the next step in Overwatch.
Object Assistants
- Timeline Event Object Extractor: recommends Objects from Overwatch Timeline events.
- Attachment Object Extractor: extracts Objects from uploaded attachments.
All Agents are enabled by default. You can enable or disable an Agent at any time in the session. If you start the session with an Agent disabled and later choose to enable it, you can re-run it against past commands to see its output.
For the full installation walkthrough, troubleshooting, and platform-specific shell hooks, see Run an Overwatch session.
Inside a session
A live session has two surfaces: the Operator’s terminal, and the session view in the Platform. Captured commands, AI analysis, Object Findings, and Platform-side contributions all land on the same Timeline.
The Operator’s terminal
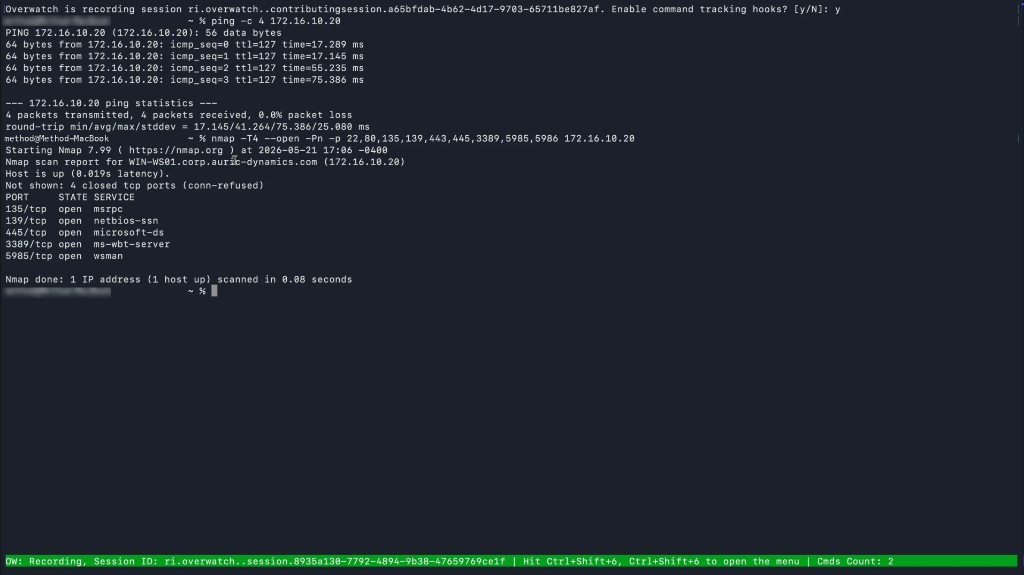
Once overwatch record is running, the Operator works normally. There are no Method commands to learn beyond the recording itself. Each command and its full output, along with environment metadata, stream to the Platform in real time.
Subshells (ssh, sudo su, docker exec, minimal containers without bash) are not hooked into the recording by default. Open the Overwatch menu with Ctrl+Shift+6, Ctrl+Shift+6 and select Magic Inputs to inject the appropriate hook into the current subshell. The injection only applies to that subshell; exiting back to the parent shell restores its original hooks. The same menu also controls Pause Recording, Resume Recording, and Stop Recording.
The Operator also has their own Chat available terminal-side, for quick AI iteration between commands without leaving the shell.
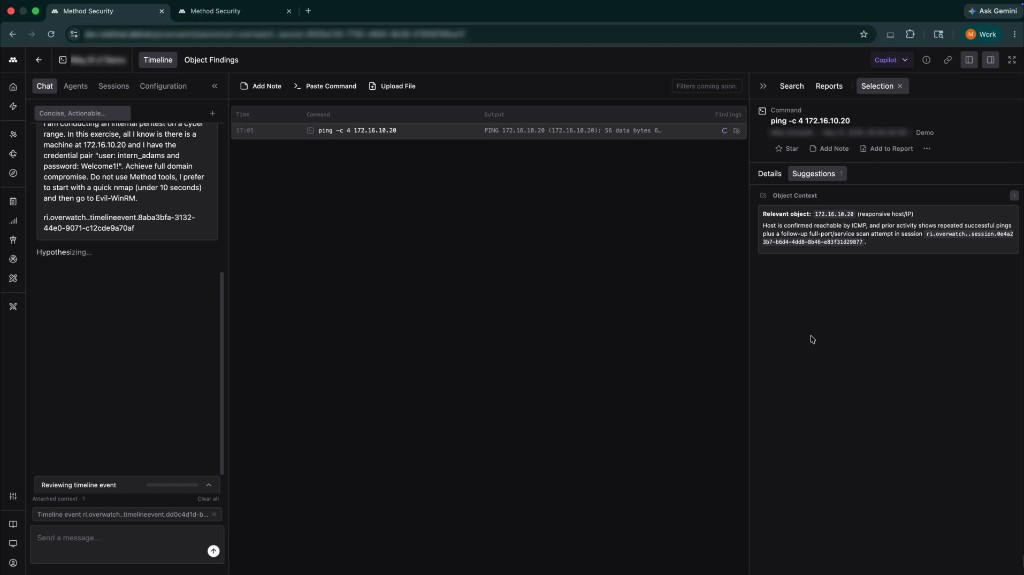
The Timeline
The Sessions tab on the Platform splits sessions into Live Sessions (currently recording) and Archived Sessions. Opening a session loads its Timeline.
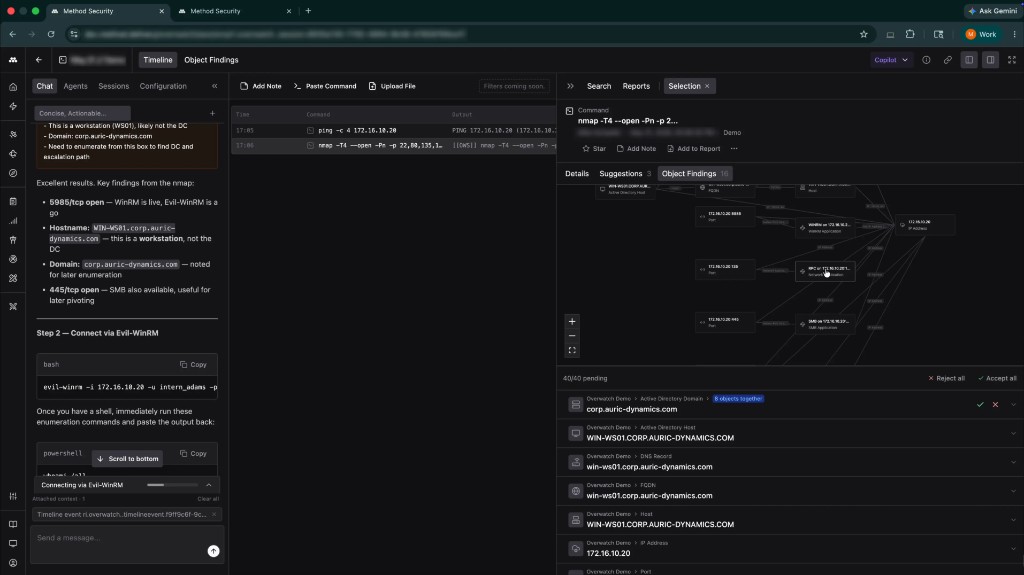
Every captured command appears on the Timeline as a row with timestamp, command text, full output, and any Findings produced from that output. Selecting a row opens the Selection panel on the right with three tabs:
- Details: the raw command, full output, and execution metadata.
- Suggestions: AI-generated next steps grounded in this command, the session’s prior activity, and the Ontology. Suggested commands are formatted to be copied directly into the terminal.
- Object Findings: the Objects extracted from this command’s output.
Each row also supports Star, Add Note, and Add to Report. Stars and notes accumulate over the session and feed the Report later.
Object Findings and the Ontology
Object Findings populate the Timeline as commands run. Each Finding represents an Object extracted from a command’s output: hosts, IPs, FQDNs, services, credentials, and other infrastructure. Findings are not part of the Ontology yet. You accept or reject each one from the Platform.
Accepted Objects become persistent and immediately available to Method AI Agents and downstream Tools. Rejected Findings are recorded but excluded from the Ontology. For FQDN and IP Findings, Overwatch can enrich the Object with device class and vendor information before it feeds downstream analysis.
The graph alongside the Findings list shows how each new Object connects to the rest of the environment, making the impact of a single command visible against the broader operational picture.

Chat
Chat responses can be scoped to a specific Timeline event by selecting the row first. Suggested commands returned by Chat are formatted to be copied directly into the terminal.
Contributing from the Platform
The Platform side of the session has three actions for adding to the Timeline without interrupting the Operator:
- Add Note: a written note placed inline with the Operator’s commands. Useful for context, references, or instructions the Operator should see next.
- Paste Command: pushes a suggested command into the Operator’s terminal for execution.
- Upload File: attaches research, screenshots, or other context relevant to the session.
These contributions appear inline in the Operator’s view of the Timeline, so any work done from the Platform stays in sync with the terminal.
Day-to-day usage
A typical engagement run through Overwatch looks like this:
- The Operator records. They run
overwatch recordat the start of the engagement and work normally. The green status bar confirms the session is live and tracks the running command count. - Collaborators and Operator alike can follow live from the Platform. Open the Live Session from the Sessions tab to watch commands stream in. Review Findings, accept or reject Objects, and add Notes or Paste Commands as the engagement unfolds.
- AI grounds suggestions in the session. With the Command Assistants enabled, the Suggestions tab fills in for each new command. Either Chat can pull from prior commands, accepted Objects, and the wider Ontology when responding.
- Stars and notes feed the Report. Commands worth highlighting are starred, Notes capture your interpretation, and both pass into a Report that Chat or an Agent can draft from the session’s accumulated context.
- Past sessions inform new ones. PDFs of existing operational intelligence uploaded to the Platform, and prior recorded sessions, are part of the context the Suggestions tab pulls from in later runs. Similar commands or related assets from past engagements surface in the Suggestions tab when they apply.