Filter, investigate, and close Issues
Filter, investigate, and close Issues using Explorer, the Object graph, and Agents.
The Issues app
The Issues app is your central view for triaging security findings. By default, it shows open, Validated Issues from the last 3 days.
A Validated Issue is one that AI Agents have confirmed as a real finding. This lets you focus on verified results rather than sorting through unverified noise.
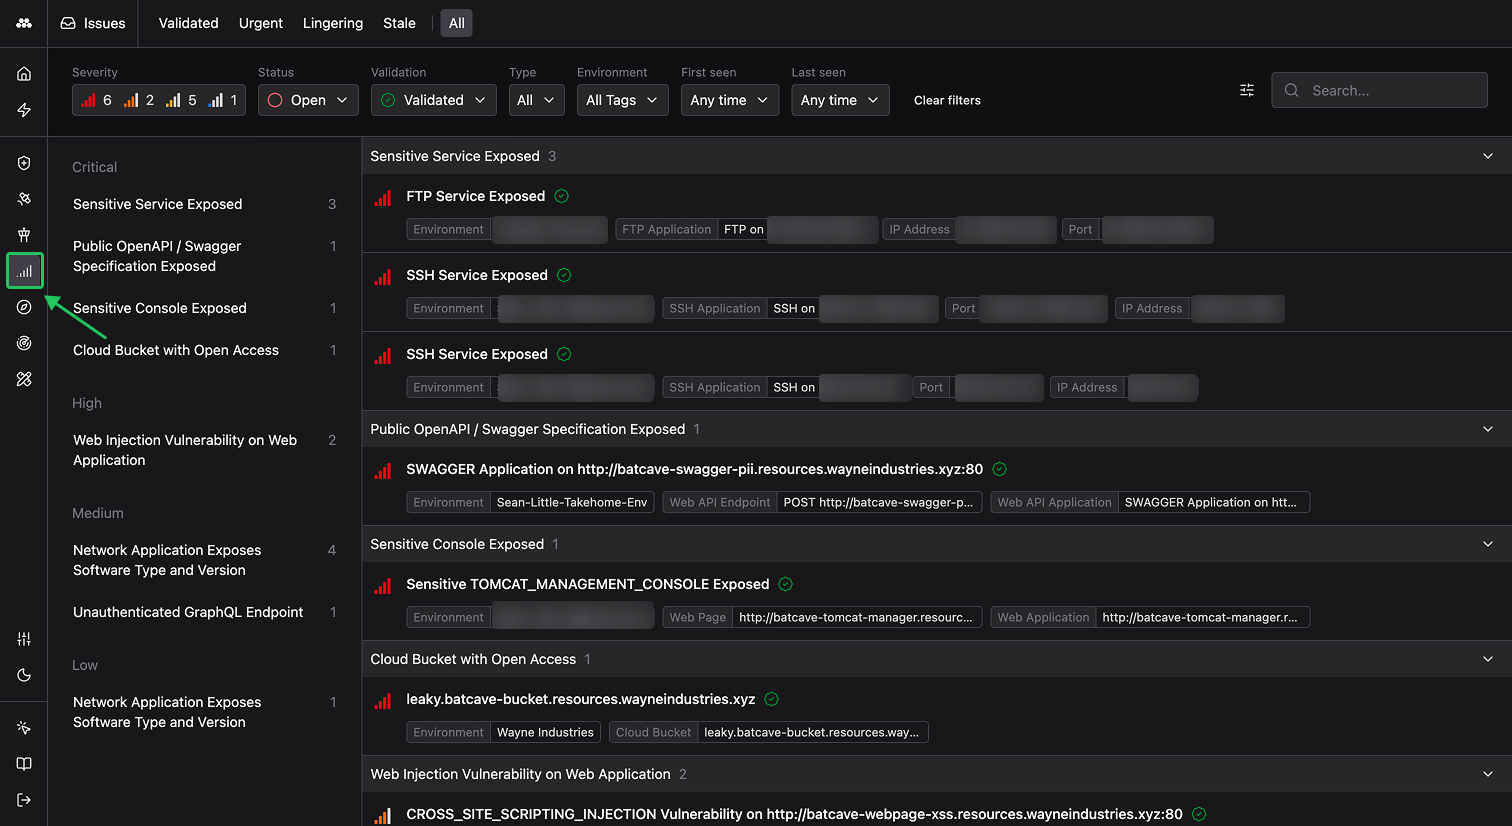
Use the tabs across the top to switch between Validated, Urgent, Lingering, Stale, or All Issues. The filter bar lets you further narrow results by:
- Severity: Critical, High, Medium, Low, or Info
- Status: Open or Closed
- Validation: Validated, Unvalidated, or All
- Type: Filter by specific Issue type tags
- Environment: Scope to a particular Environment or tagged group of Environments
- First seen / Last seen: Filter by time range
The left sidebar groups Issues by Issue type within each severity level, making it easy to spot patterns across your environments.
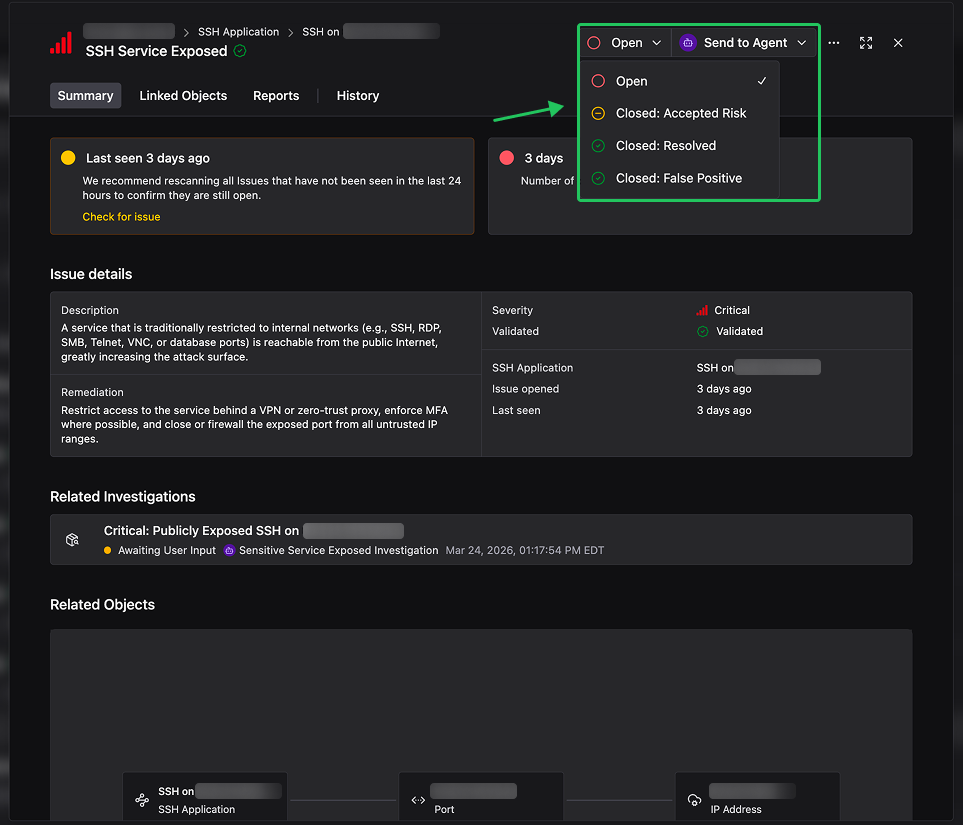
Change an Issue’s status using the drop-down menu at the top-right corner of any Issue.
Advanced filtering in Explorer
Apply more advanced filters and filter groups to explore Issues across your environments using Explorer. See Filter data for details.
Investigate an Issue
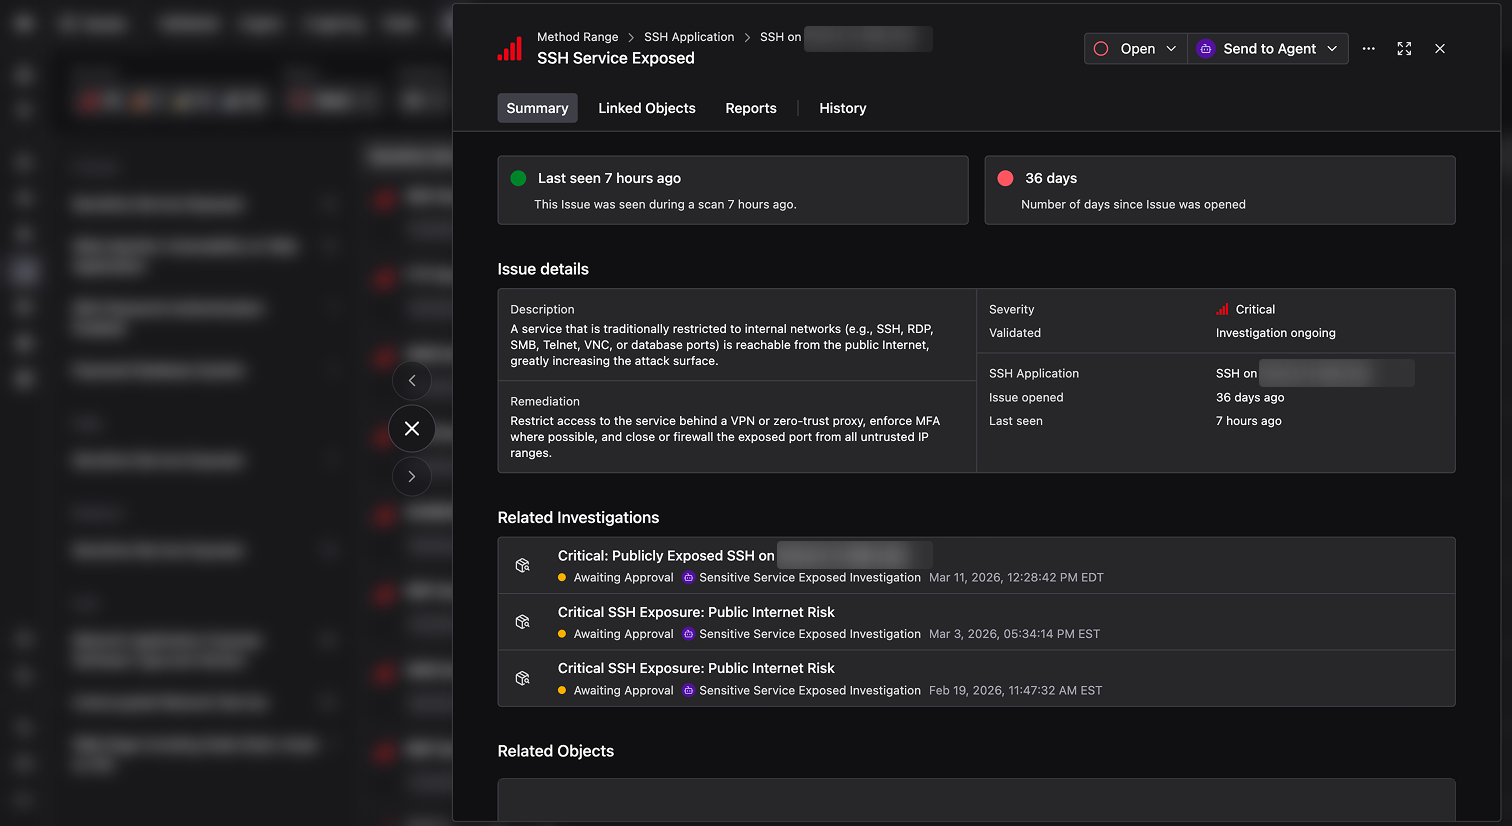
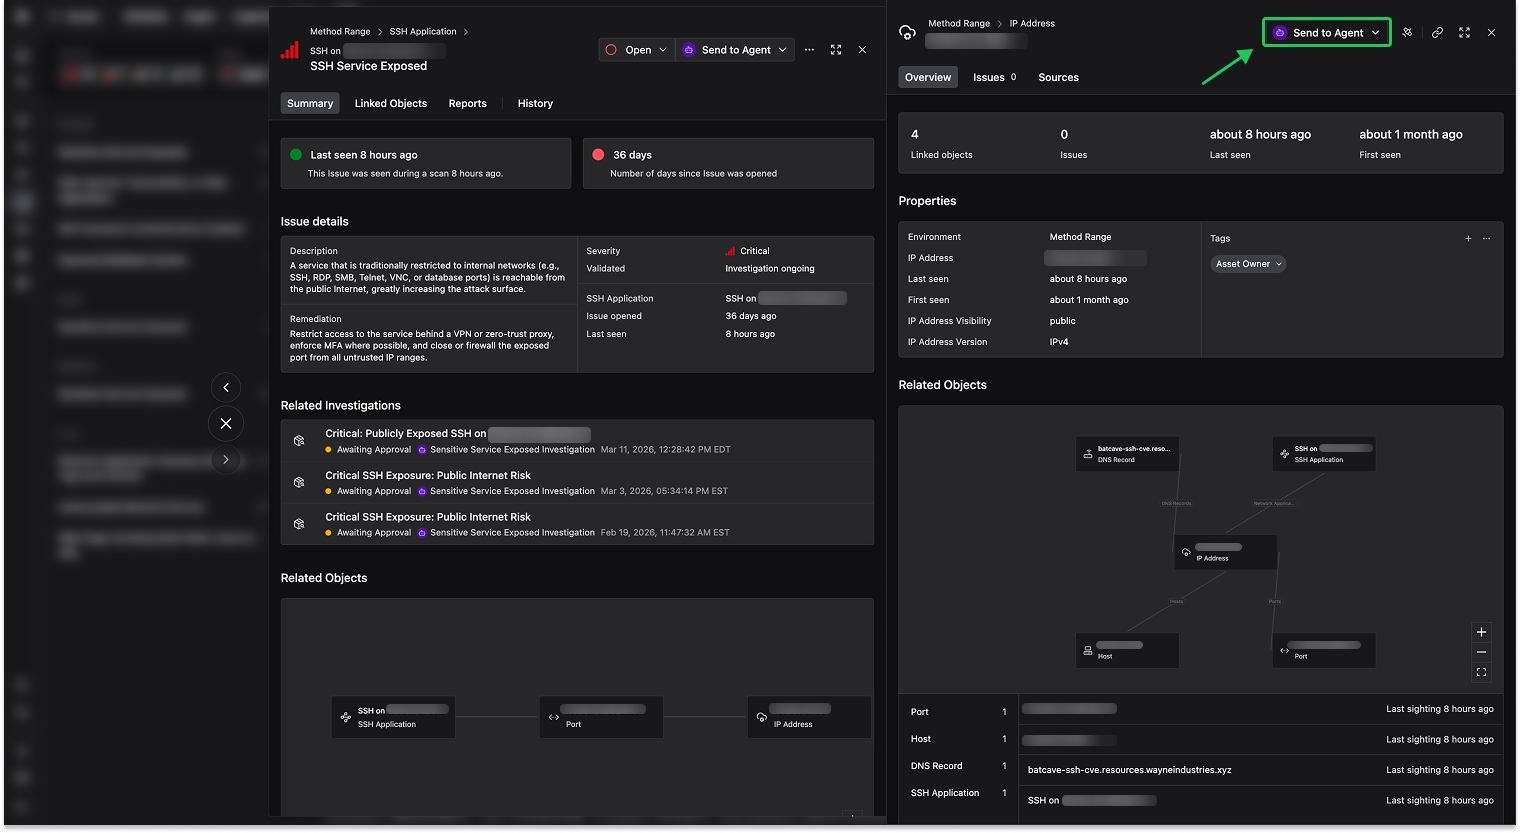
Click into any Issue to open its detail panel. The Summary tab gives you a full picture at a glance:
- Last seen and age: When the Issue was last observed and how long it has been open
- Issue details: A description of the finding, its severity, validation status, the impacted Object, and remediation guidance
- Related Investigations: Past and ongoing Agent investigations tied to this Issue
- Related Objects: The Objects connected to the finding
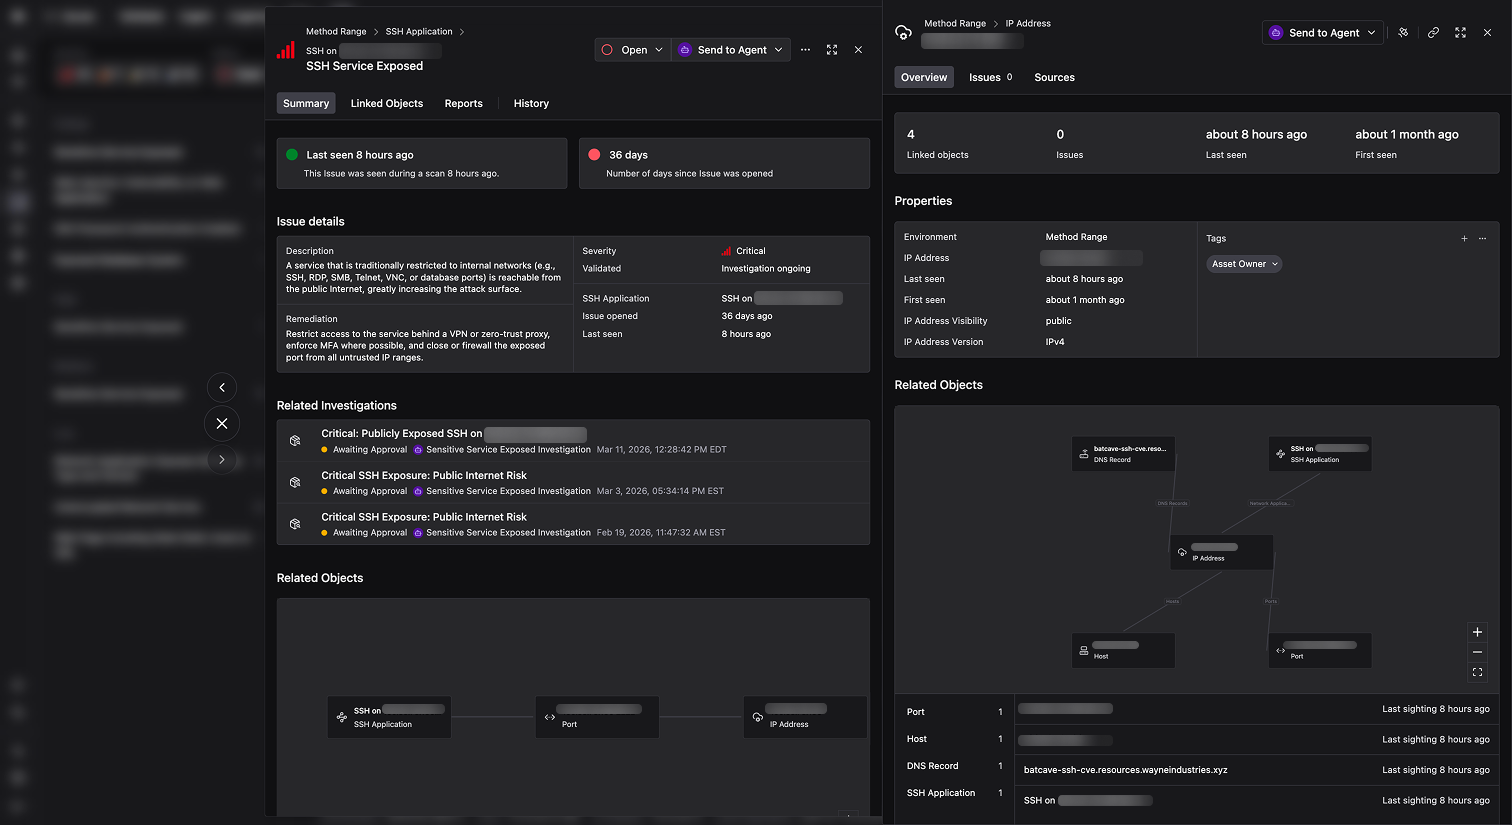
Use the tabs to explore further: Linked Objects to see the full asset graph, Reports to generate exportable documentation, and History to track status changes over time.
The Related Objects graph visualizes how an Issue’s impacted asset connects to other Objects in the Ontology. Labeled edges show the relationships between Objects, such as an SSH Application running on a Host at a specific IP Address. Use the graph to understand blast radius, trace exposure chains, and identify affected dependencies.
Investigate Issues with Agents
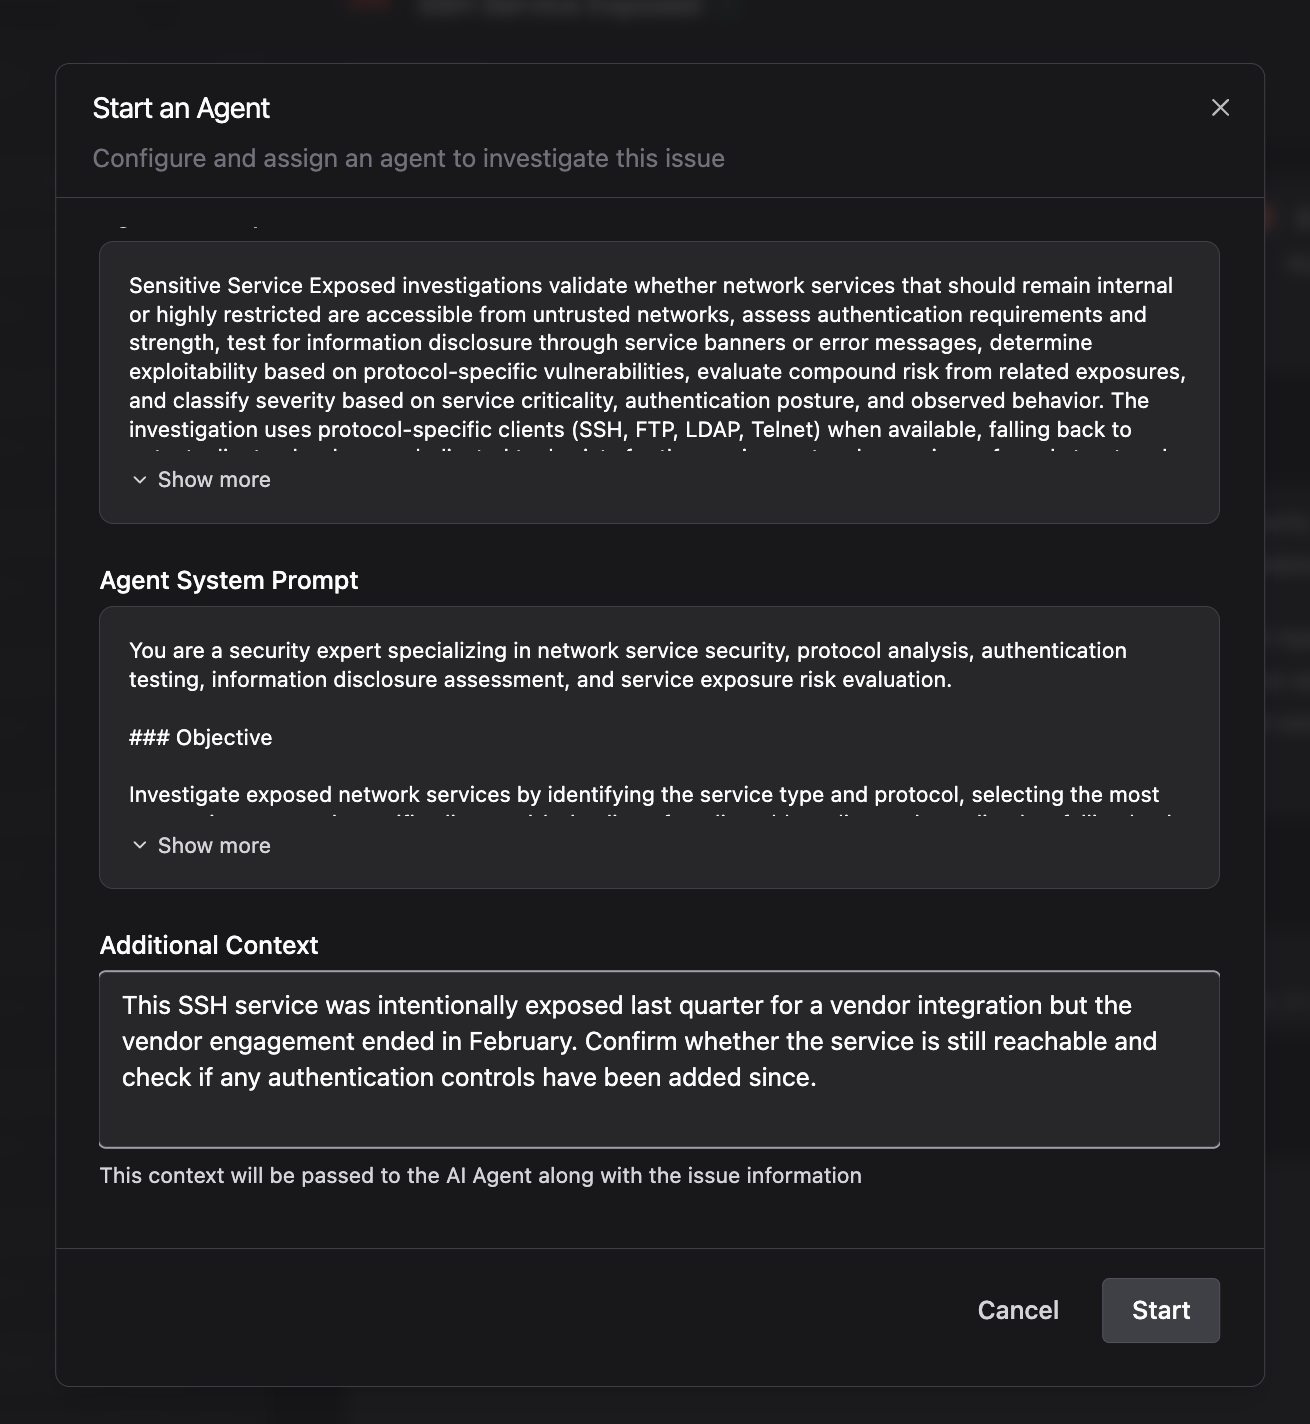
From any Issue, click Send to Agent to kick off an Agent investigation. Select an Agent and optionally provide additional context to guide its analysis. The Agent will investigate the Issue, then report back with findings, validation, and recommended next steps.
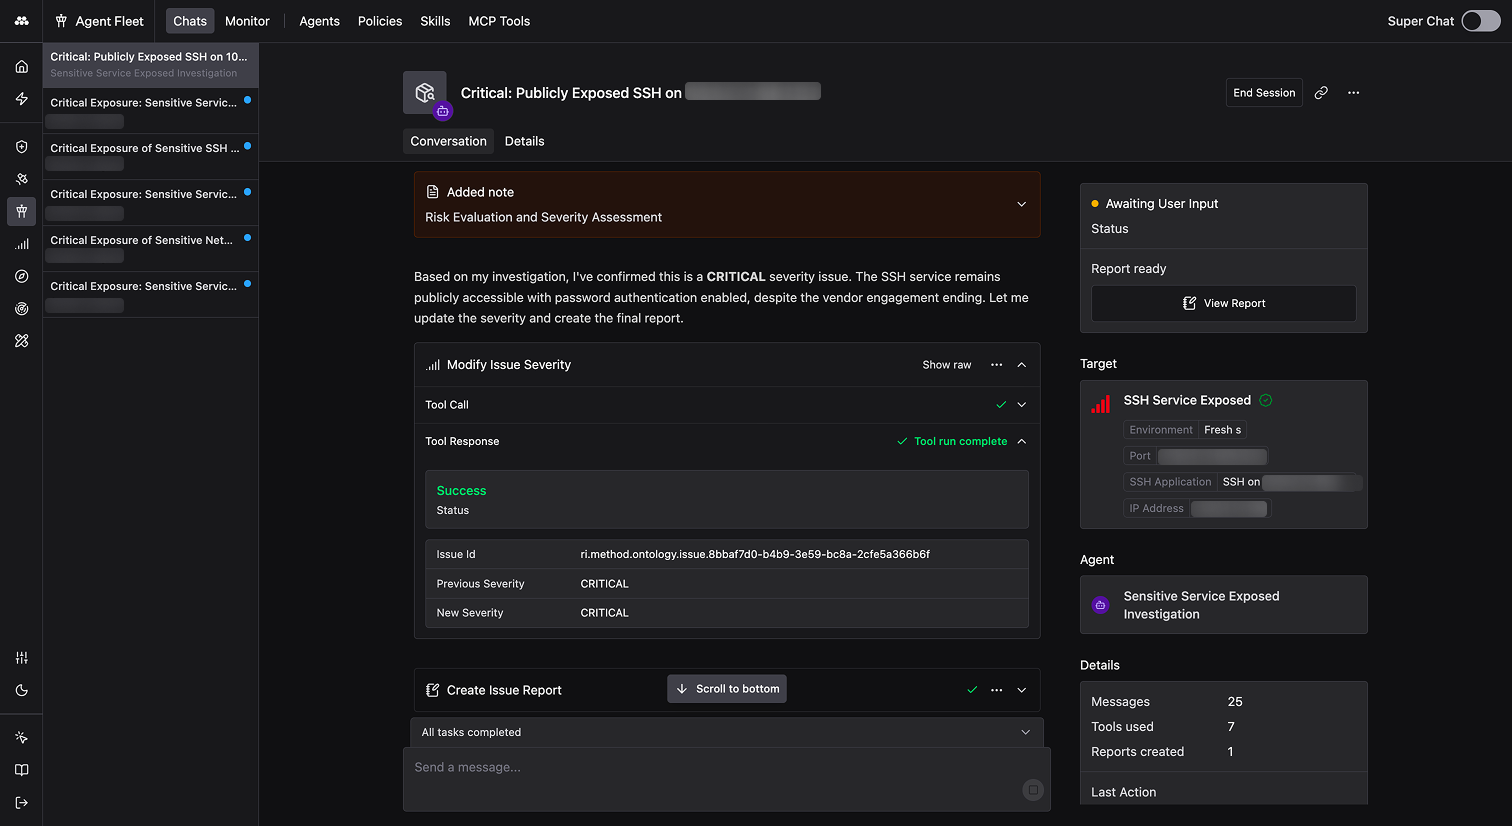
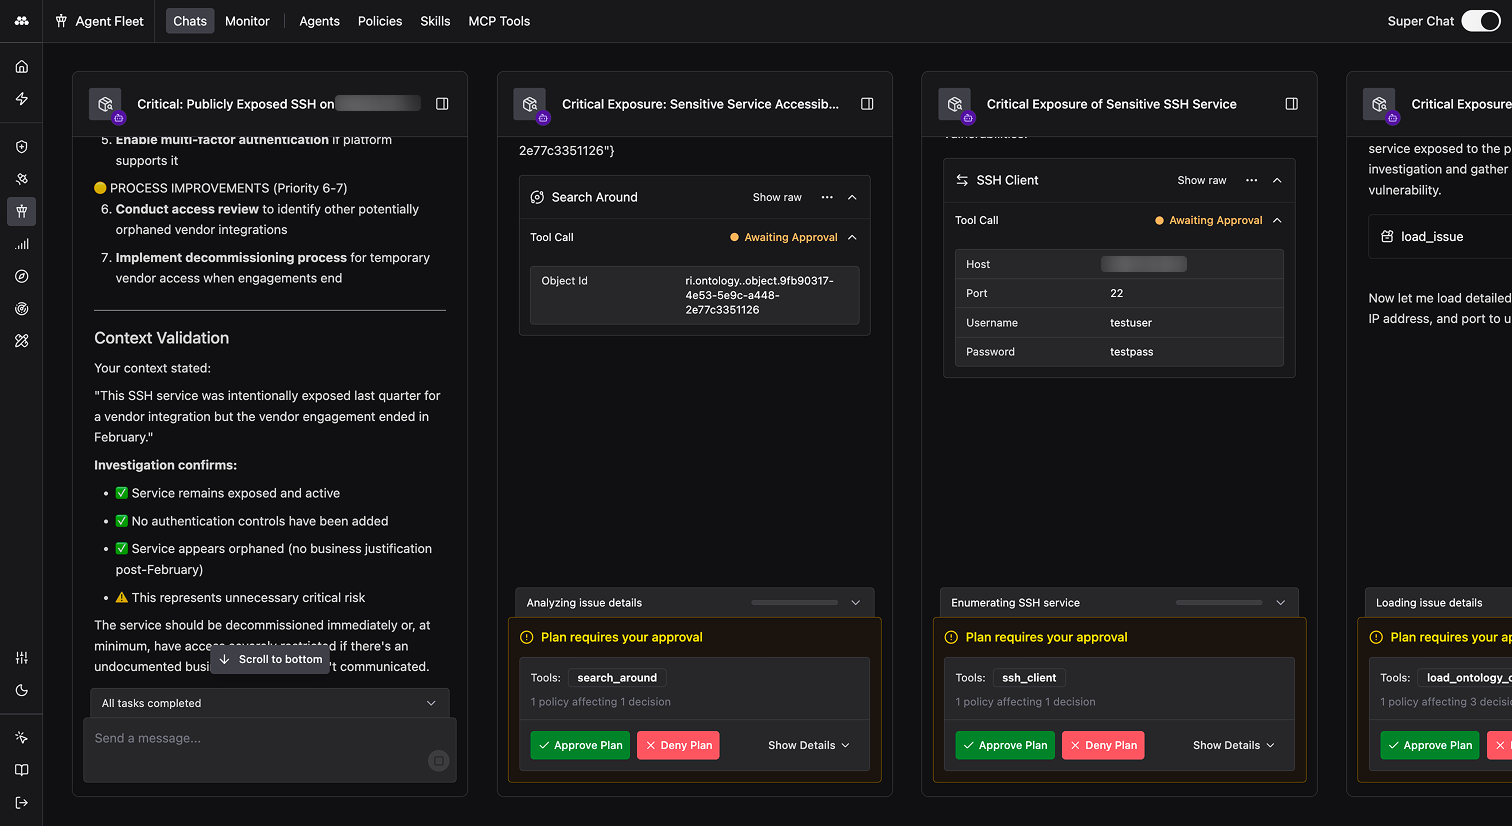
Once started, the Agent begins its investigation. Policies govern what each Agent can do: a Tool call may be automatically approved, denied, or held for your approval depending on the rules you configure. Monitor progress in real time from the Agent Fleet app.
For more on creating and configuring Agents, see Create an Agent.