Selective Auto Assume Breach
This is the second stage of the Offensive Operations maturity ladder.
Operator Augmentation ran the engagement through Overwatch, keeping you in your own terminal with Method’s Agents following the operation and providing suggestions and context. This stage moves the engagement into Operator, Method’s unified offensive workspace, and starts from an assumed-breach foothold: a Jackal already running on a target you would otherwise have had to compromise to reach.
In these engagements, Method provides you, the cyber operator, with an AI Copilot, Tools, C2, the Tool Graph, the Network Map, and automatically drafted Reports inside one workspace.
Running an assume-breach engagement this way will give you:
- A live Operation grounded in the foothold Jackal, with every C2 configuration, Method Tool execution, and Object discovery captured, organized, and visualized.
- An AI agent copilot that pulls from the Operation graph, the Ontology, and your Environment intelligence to analyze output, surface hypotheses, and recommend the next move.
- Operation visualizations, such as the Tool Graph that visualizes every Tool execution and the data flowing between them and the Network Map of the target network.
- Object Findings added to the Ontology, so new hosts, services, and credentials become persistent Objects available for exploration, analysis, in future Operations, and to Method AI Agents.
- A Report drafted by you and AI collaboratively, drawing from activity in the Operation.
Setup
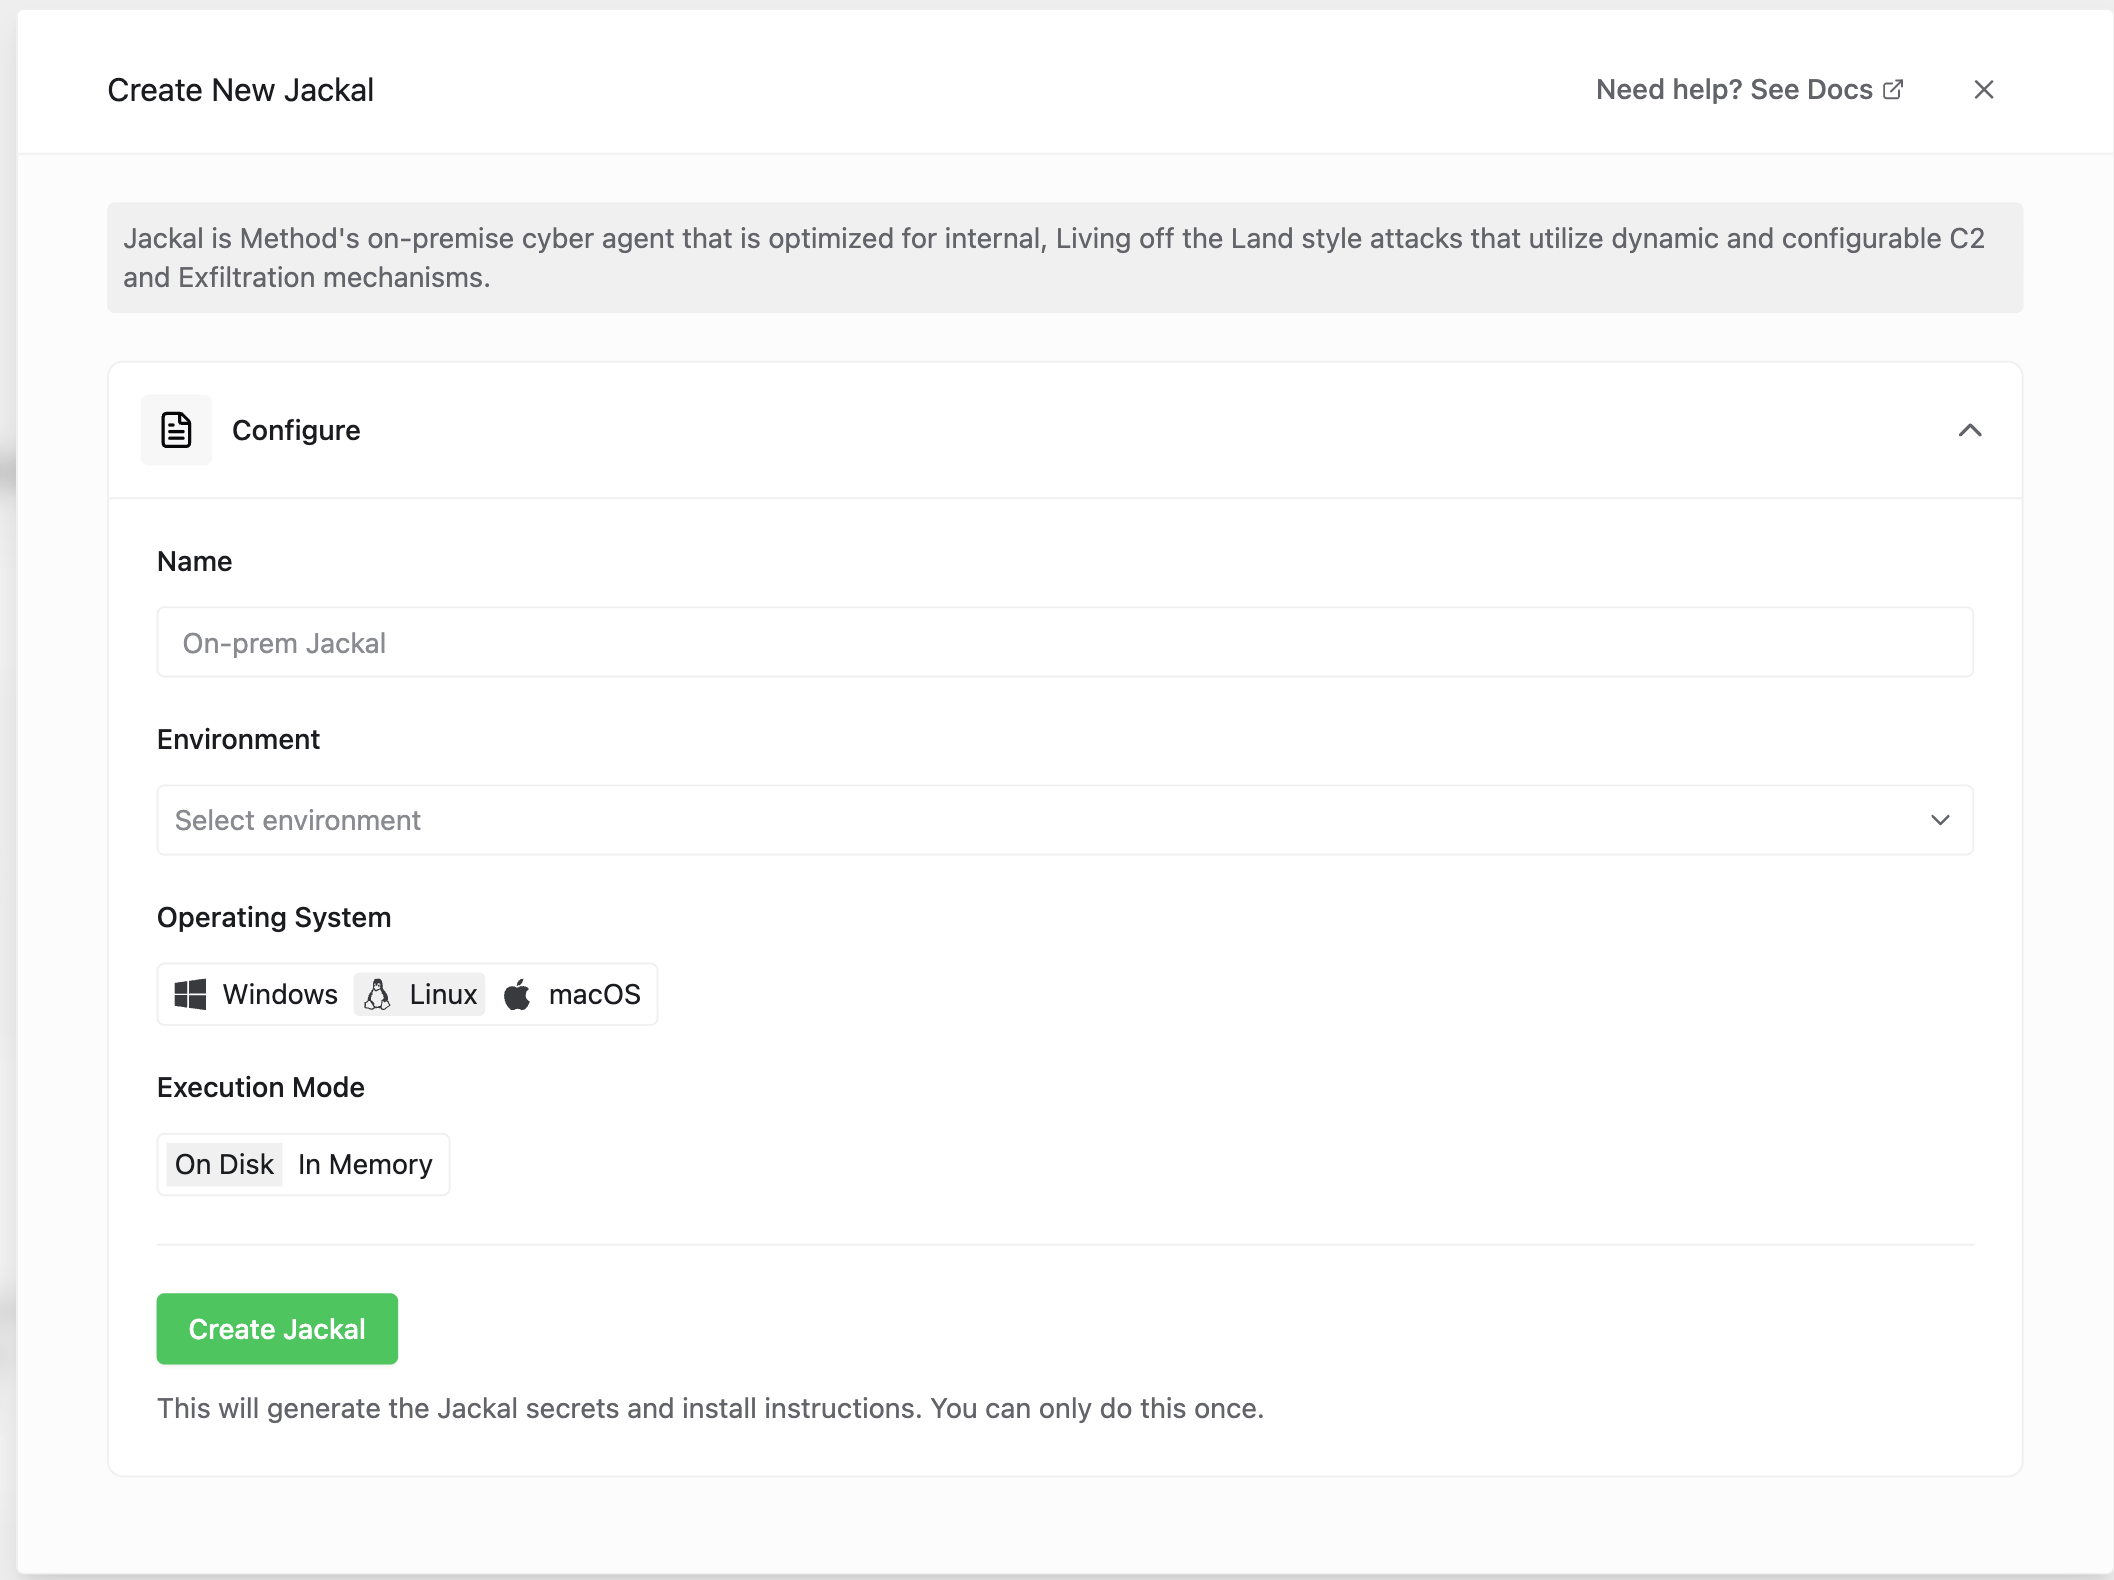
Create a Jackal
The Jackal is Method’s lightweight, runtime-configurable C2 implant. It is the access vector the Operation will use to act on the target.
From the Method Platform, open Install a Jackal in the left navigation, give it a name, choose the Environment, the operating system, and execution mode, and click Create Jackal. Method generates the install command and a downloadable binary for your target. For the full walkthrough (configuration options, exfiltration controls, C2 parameters), see Install and configure a Jackal.
Drop the Jackal on the assumed-breach target
Install the Jackal binary onto the in-scope host that represents the conceded foothold. This is the machine you would otherwise have had to compromise to reach: a workstation a phishing target would have opened, a service account host an exposed credential would have unlocked, or any other system whose initial access is being assumed for the engagement.
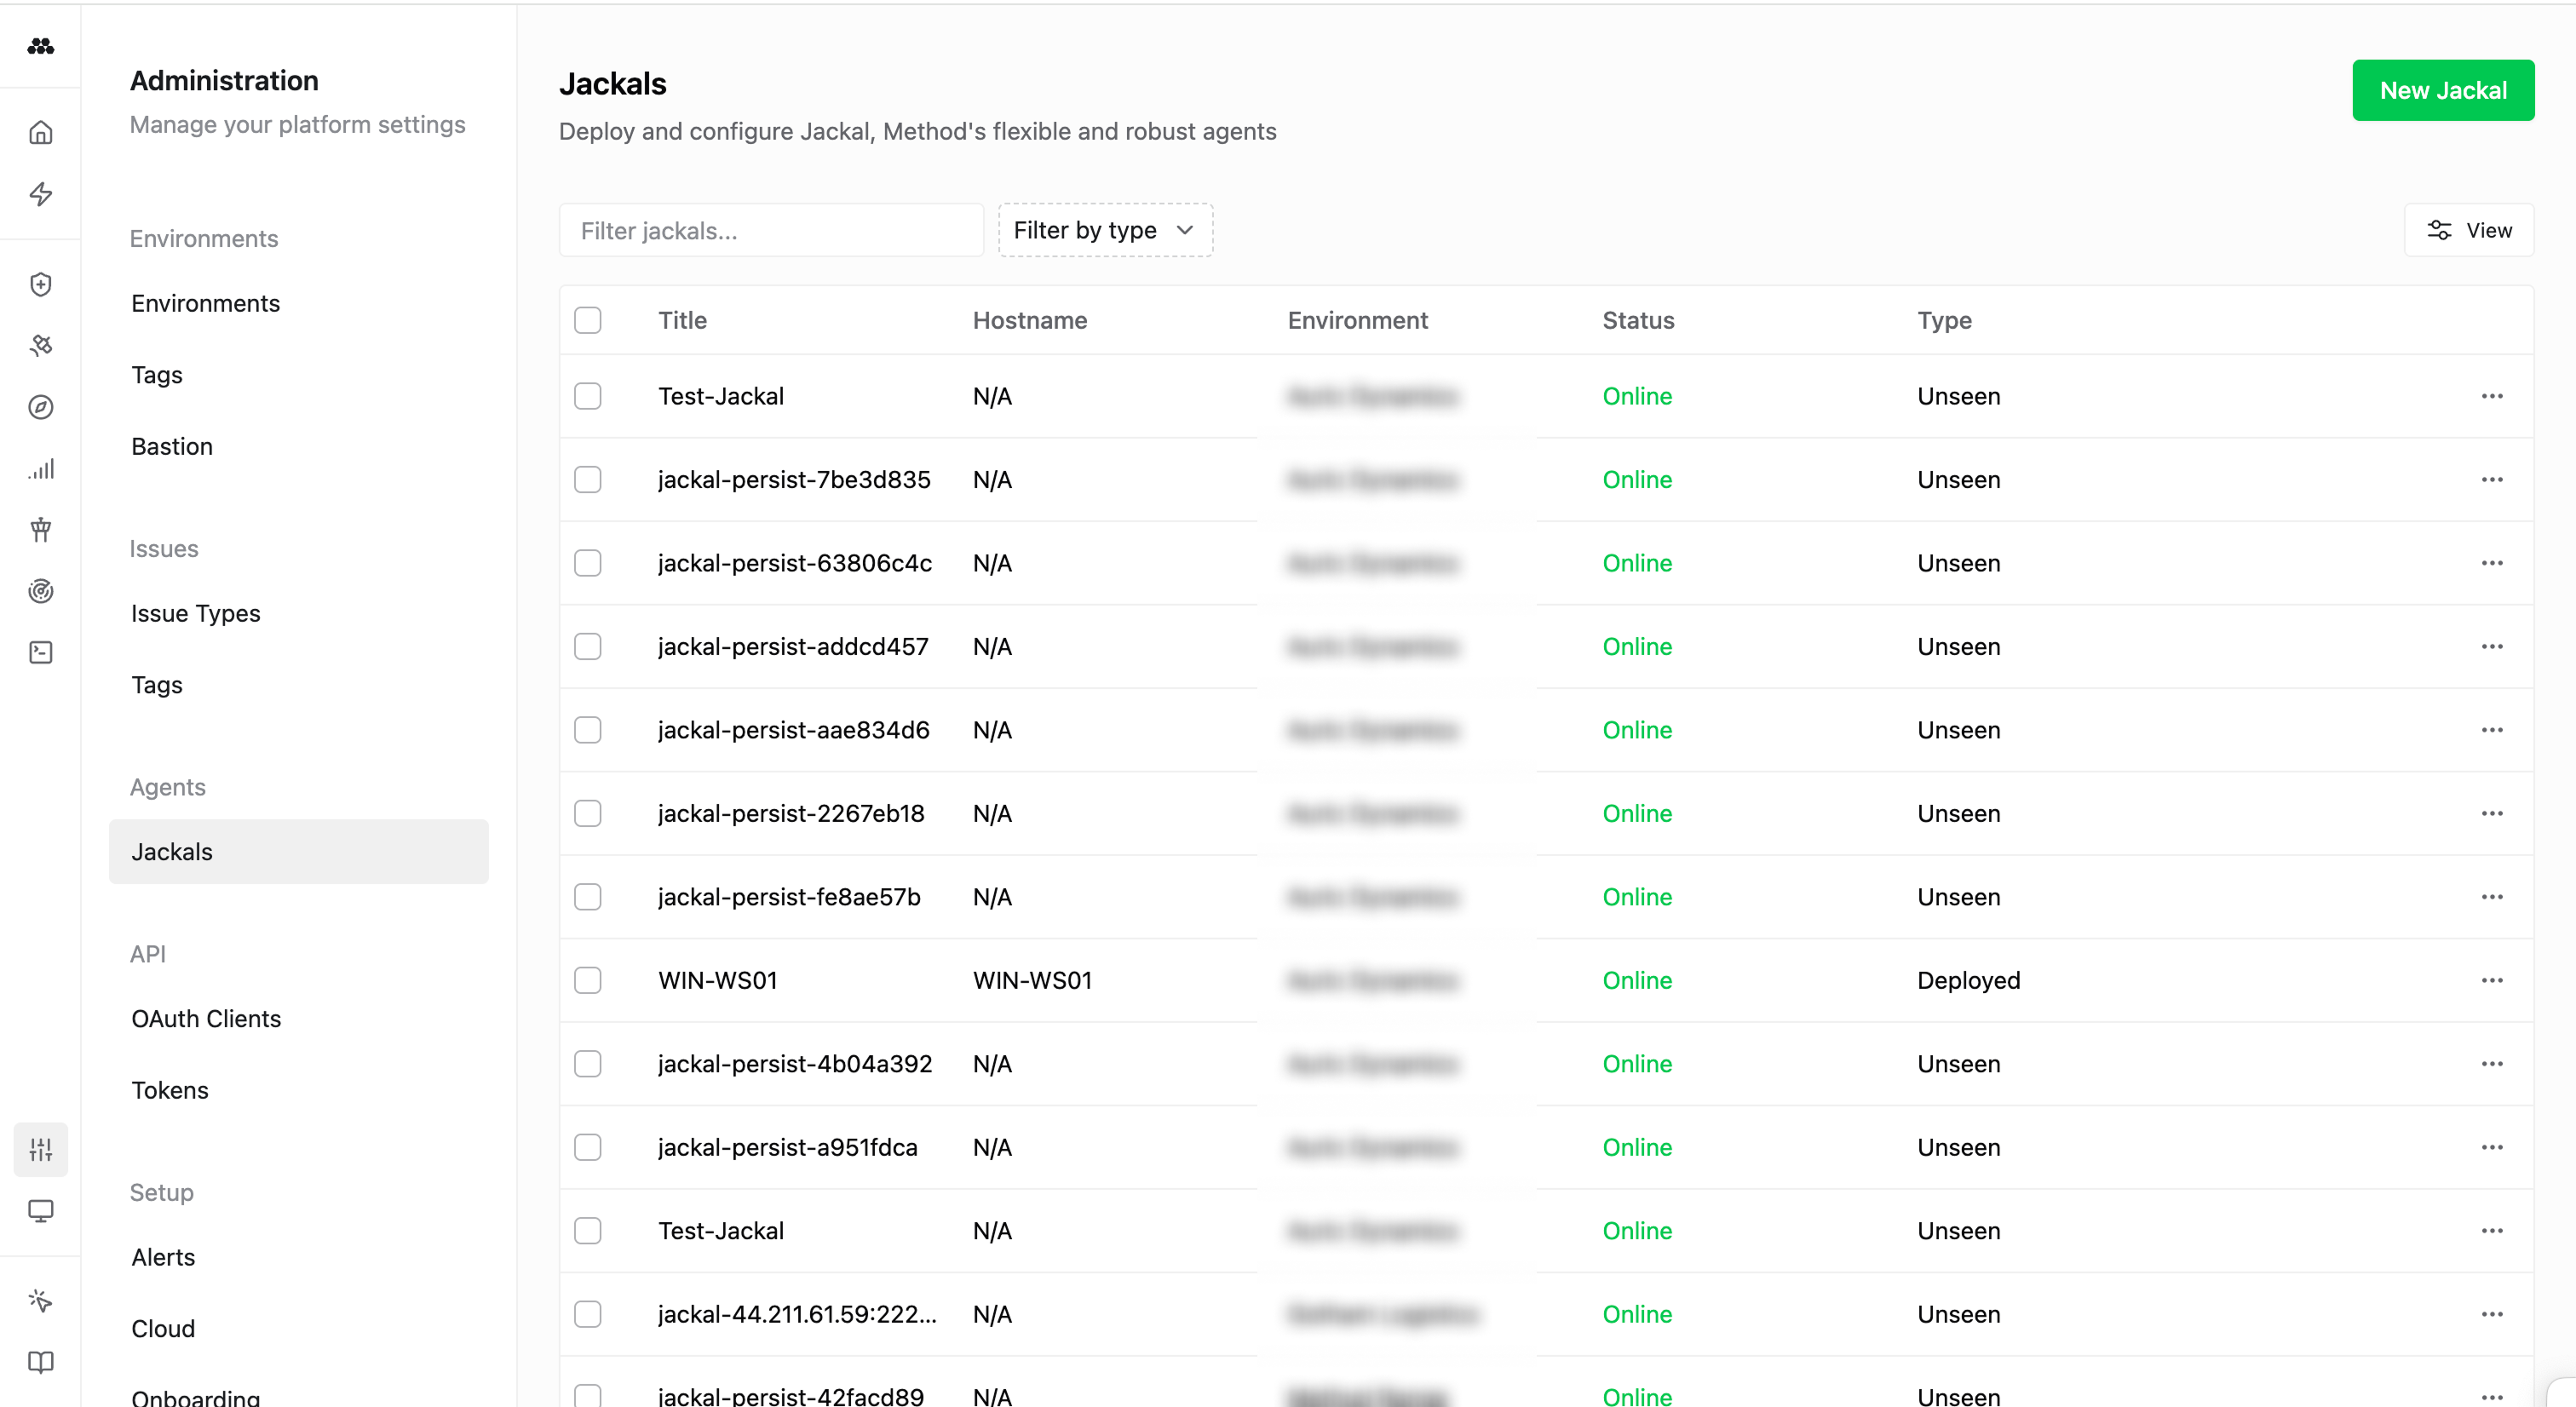
Once the Jackal is running, it reports back to the Platform and becomes available as an access vector for new Operations. Confirm it appears under Admin > Jackals with a healthy status before moving on.
Run an Operation in Operator
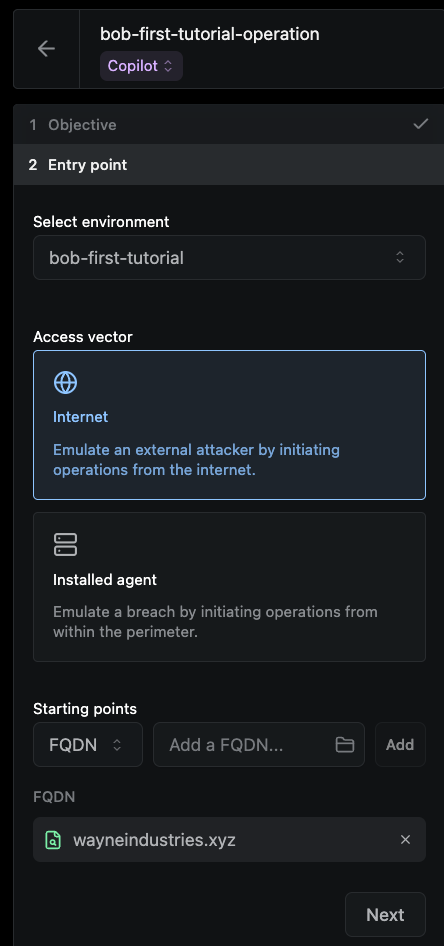
Open the Operations app, click New in the top-right, and select Operation. Method opens the New Operation form. Fill it out with the assume-breach engagement in mind:
- Details: name the Operation and write a clear Objective for what success looks like (the lateral movement, privilege escalation, or specific objective the engagement is meant to test).
- Entry point: pick the Environment the foothold lives in, select the Jackal you just deployed as the access vector, and add any starting Objects already known from the foothold (hostnames, IPs, credentials).
- Intelligence: leave the Adversary unset for a Selective Auto engagement. Adversary-driven Operations belong to the next stage, At Scale Adversary Emulation.
- Rules of Engagement: set the RoE for the engagement up front. This is where you scope tool use, define what is off-limits, and constrain risky actions before any Tool runs.
- Object Watch: declare any Object Types you want Method to alert on the moment they appear (Domain Admin credentials, specific service banners, paths to high-value assets).
Click Begin Operation to drop into the Operator workspace.
For a step-by-step walkthrough of the Operation form, see Run your first Operation.
Inside an Operation
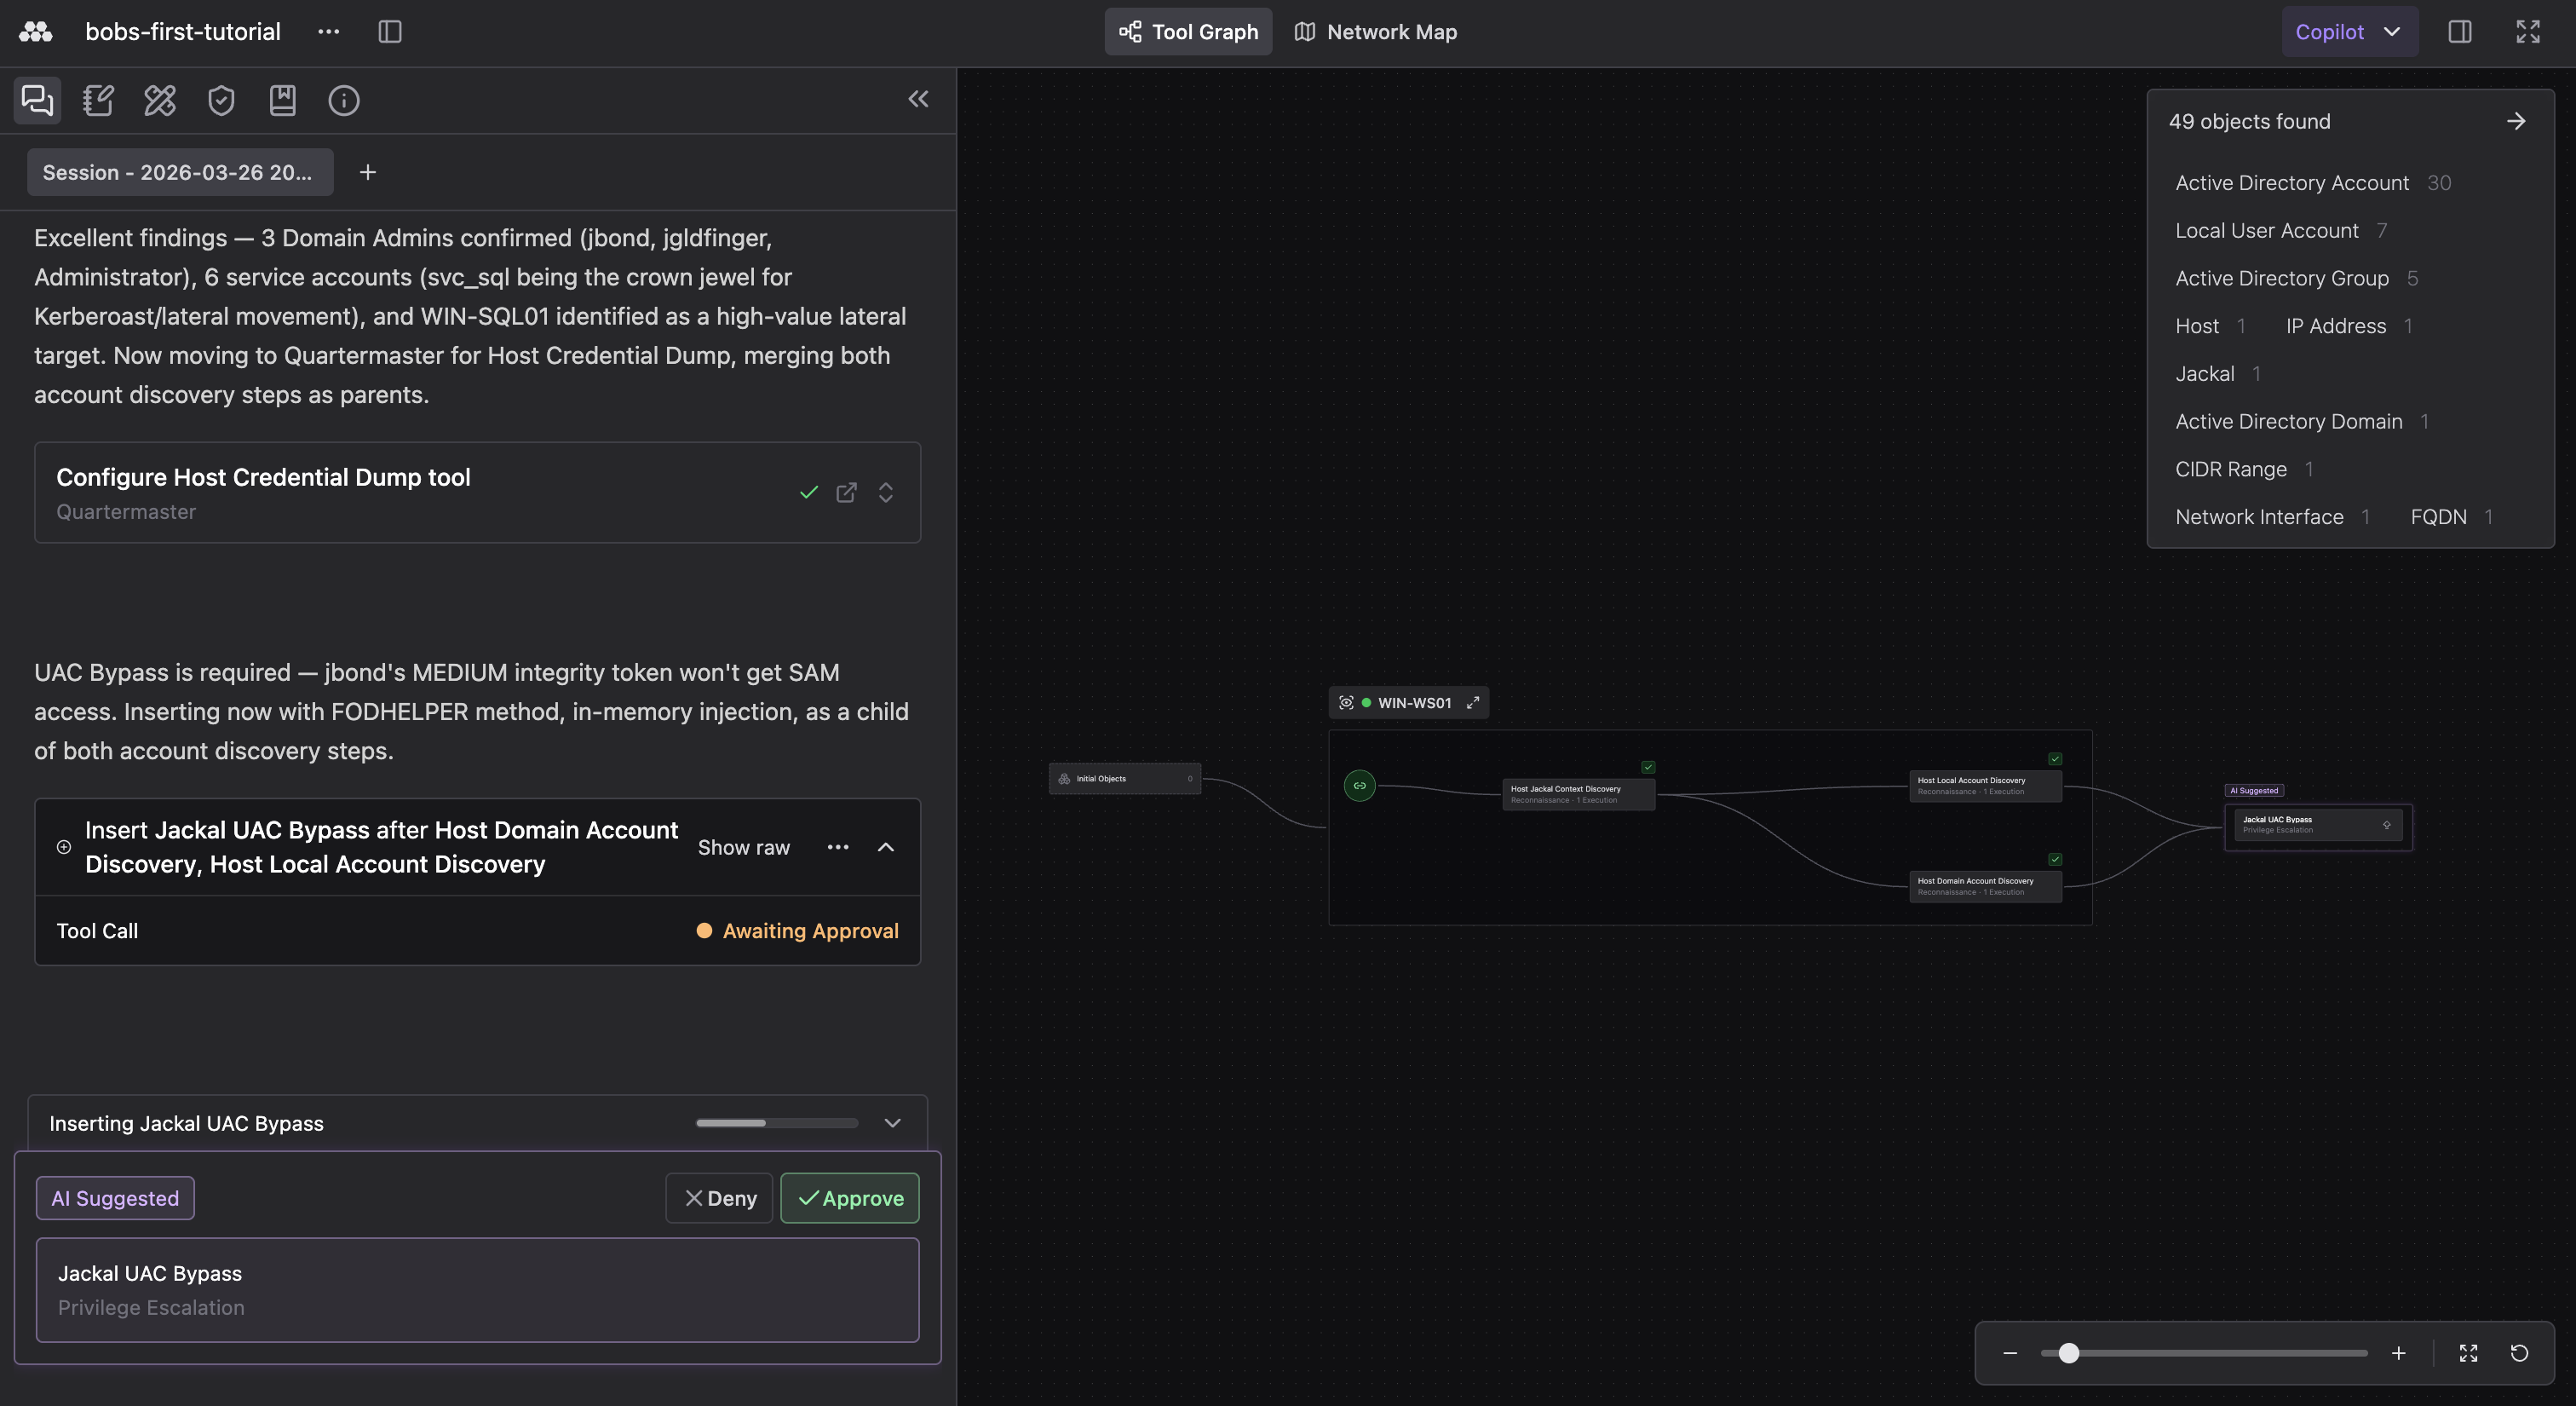
A live Operation in Operator gives you a single workspace for C2, data, Tools, and AI. Every action you take and every Tool the Jackal runs lands on the Operation graph. The AI Copilot can interact with the same Operation context you do.
The Operator workspace
Operator is built around three panels:
- Left panel: the Operation’s objective, RoE, attached Intelligence, Object Watch list, and the full Tool Library. Open it to revisit what the Operation is for or to pick a Tool from the catalog without leaving the workspace.
- Center: the Tool Graph or the Network Map, switchable as tabs. The Tool Graph shows the Operation’s progress; the Network Map shows the target network as discovery fills it in.
- Right panel: Objects and Issues discovered in the Operation. Select a node on the Tool Graph to scope the panel to that step’s findings, or deselect to see the full lineage.
The Jackal is wired into Operator as an access vector. When a Tool needs to run against the foothold or anything reachable from it, Method routes execution through the Jackal automatically.
AI Chat
The AI agent in the Chat tab is your reasoning partner in the workspace. It reads the Operation graph, the Ontology, the Environment intelligence, and the RoE, then helps you make sense of what you have and decide what to do next.
Use it to analyze a Tool’s output, ask why a discovered Object matters, get the next Tool suggestion grounded in the current graph state, or step through a hypothesis before you commit to action. Selecting a node first scopes Chat to that step; suggested commands and Tools return formatted to run with a single click.
In Copilot mode, Chat-suggested Tool insertions wait for your approval before execution. In Manual mode, Chat still answers questions and runs analysis, but it does not propose Tool runs. See Operator AI for the agents and sub-agents available.
The Tool Graph
The Tool Graph is the Operation’s source of truth. Every Tool execution is a node, and the edges between nodes are the data types flowing from one Tool’s output into the next Tool’s input.
The graph builds itself as the Operation progresses. Selecting any node opens its execution details, the Objects it created, the Issues it surfaced, and the path it took into the next step. Tracing a Finding back to the Tool run that produced it is one click; the same is true in reverse for understanding what a single Tool unlocked downstream.
The Network Map
The Network Map is the topology view of the target network. As the Operation discovers hosts, services, and the relationships between them, the Map fills in.
It is the fastest way to see whether discovery is converging on the engagement’s objective. New surfaces appear there the moment a Tool reports them, with the Jackal-backed foothold visible at the center as the anchor for everything that follows.
Reports
The Report for an Operation is drafted by AI from the Operation’s activity: the Tool Graph, Object Findings, RoE, and the engagement’s stated Objective. You review the draft, edit what you want, and decide what makes the final version before it ships.
Operation Reports live on the Reports tab of the Operations app alongside Reports drafted from Overwatch sessions, so a multi-surface engagement still produces a single coherent deliverable.
Day-to-day usage
A typical Selective Auto Assume Breach engagement in Operator looks like this:
- Plan the exercise and execute in Operator. All of the work (Tool execution, C2 through the Jackal, Object review, AI reasoning) happens inside Operator.
- Leverage AI chat as a thought partner. Ask Chat about a finding, request analysis of a Tool’s output, or have it walk through the discovered Objects before you commit to a next step.
- Watch the Network Map as discovery progresses. New hosts and services land there the moment a Tool reports them, which is usually faster than scrolling the right panel. Use it to spot adjacent assets that change the engagement’s direction.
- Draft the Report from the Operation as you go. Operator AI can assemble a draft from the Operation graph, Object Findings, and the Objective.
Next steps
Step-by-step walkthrough of setting up and running an Operation in Operator, from the New Operation form to picking your first Tools.
The next stage of the Offensive Operations maturity ladder. Hand execution to an Operator AI agent emulating a specific Adversary, with you in the loop at Plan approval and mode switching.