Black Box External Assessment
This is the first stage of the Continuous Challenge maturity ladder. This page covers how to start to build an inventory and risk assessment of your external attack surface.
Setting up Method to run these assessments will give you:
- A live, continuously refreshed inventory of every domain, subdomain, IP, service, web application, and more reachable from the public web.
- An inbox of Issues that an Issue Agent has already validated, not raw scanner output. Confirmed risks land in the Validated tab. False positives, remediated findings, and over- or under-rated severities are sorted out before they hit your queue.
- An outside-in view of your environment that mirrors how an adversary would target you. Same vantage point, same blind spots.
No configuration time is required after setup, which takes only a few minutes. Scans are entirely external and require no internal, privileged access. Scans run on a schedule, Agents validate as Issues appear, and the only findings asking for your attention are ones that have already been validated by AI.
Setup
Set up an Environment
An Environment is the unit Method scopes work to. It represents the network, domains, and infrastructure you want assessed. Environments typically map to an organization, business unit, or other logical grouping of owned assets.
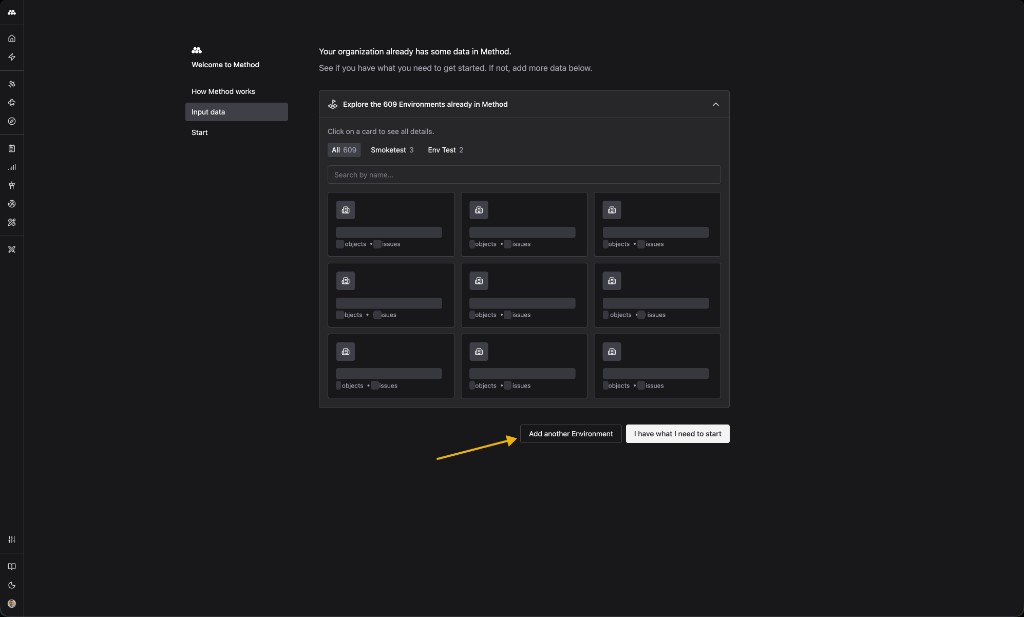
If you are setting Method up for the first time, the Welcome to Method onboarding wizard will guide you through the set up. Open the Input data step. You will see every Environment your organization already has. Click Add another Environment to create a new one.
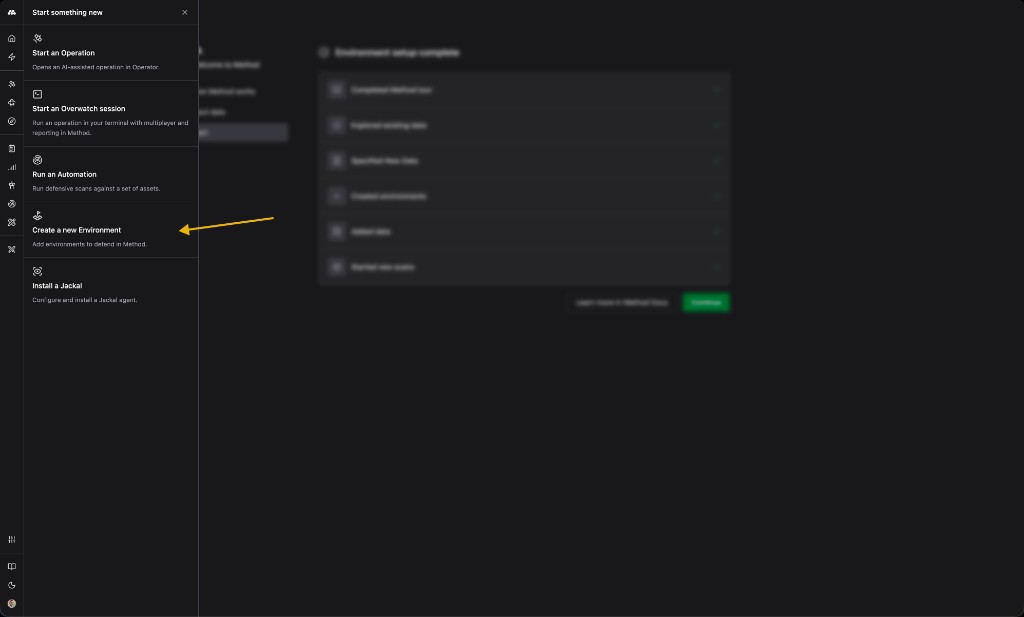
Past onboarding, the same flow is one click away from the lightning bolt quick-action menu in the left sidebar.
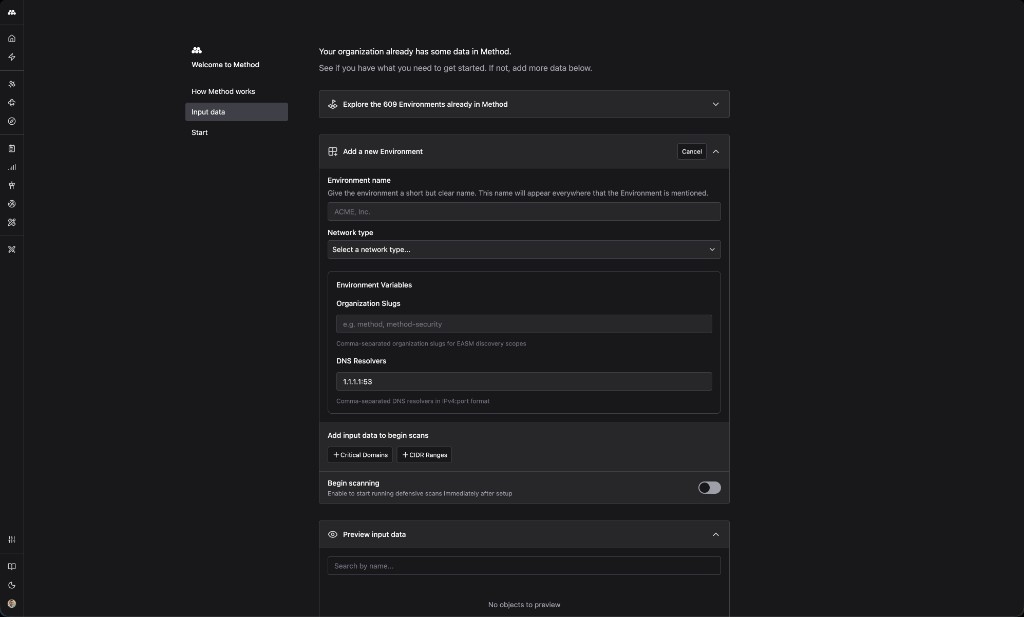
The Create New Environment form will ask you for Environment details to start:
- Environment name: A short, recognizable name. This shows up everywhere the Environment is referenced: Issues, Operations, Reports.
- Network type: On-prem, Cloud, or Hybrid, depending on your infrastructure.
Add seed data
Once you provide seed data, Method scans outward and discovers subdomains, services, web applications, SaaS surfaces, and related infrastructure.
Under Add a new Environment, fill in:
- Organization Slugs: Comma-separated organization identifiers Method uses to seed EASM discovery scopes.
- DNS Resolvers: The resolvers Method uses for DNS enumeration. The default is
1.1.1.1:53. - Critical Domains and CIDR Ranges: The seeds Method works outward from. Add FQDNs and IP ranges directly, or switch to CSV upload for bulk import.
- Begin scanning: Toggle this on to kick off scans the moment the Environment is saved.
For a full walkthrough of every Environment setting, including network type and tagging, see Create a new Environment.
Configure scans
To begin scanning, toggle Begin scanning during Environment creation. Method launches the Task automatically the moment seed data is saved.
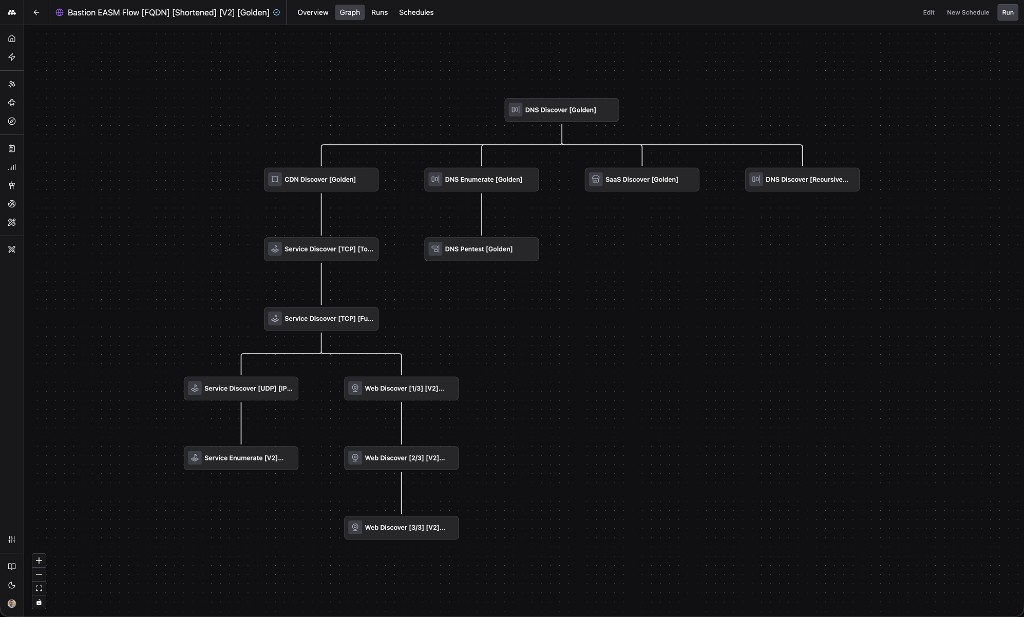
Method ships with a pre-built scan flow for external assessment: the Bastion EASM Flow. It is a Task that orchestrates every Tool involved in mapping an external footprint. DNS, CDN, and SaaS discovery feed into service and web discovery, which feed into deeper enumeration and recursive passes.
For background on Tasks, schedules, and Task Runs, see Automations. For a step-by-step walkthrough of running a Task yourself, see Run a Task.
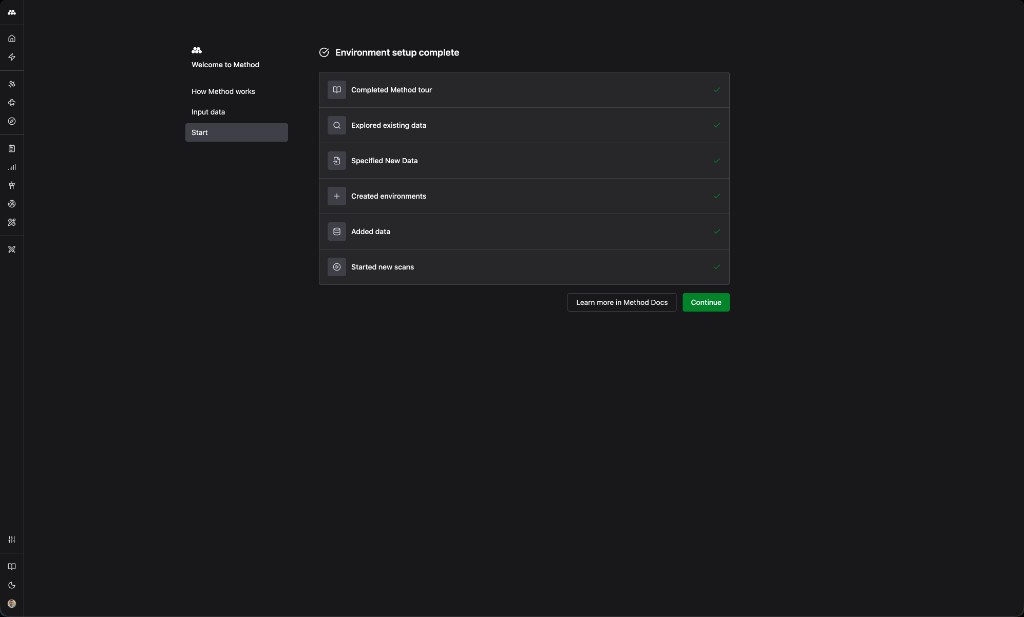
Once setup finishes, the wizard confirms the Environment is online and the first scan is in flight.
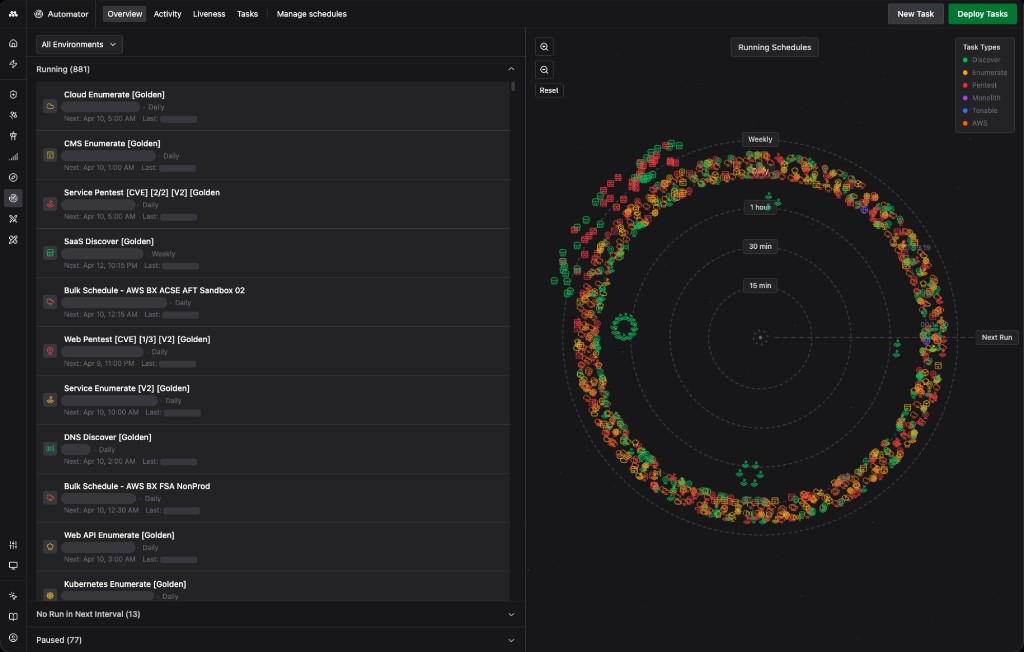
What Method does on each scan
From here, Method runs the assessment on whatever cadence you set: daily, weekly, or another schedule that fits your environment. Every run does the same three things.
Maps your environment
Every Tool in the Bastion EASM Flow is run against your seed data and subsequent discoveries, and the output is a growing graph of Objects inside the Environment: domains, subdomains, IPs, services, web applications, SaaS surfaces, and the relationships between them. New Objects from each run join and expand the graph. Every Object is linked to its history, how it was discovered, and any associated Issues, detailed below.
Scans Objects for Issues
Every Object Method discovers is scanned for Issues. These are the dozens of checks that look for exposures, misconfigurations, and vulnerabilities. They run against newly discovered Objects and against existing Objects on every subsequent scan.
Method creates an Issue every time an Object matches an Issue definition. Each one carries severity (Critical, High, Medium, Low, or Info), a description of what it is and why it matters, a graph of the affected Objects, remediation guidance, and a history showing when it was first seen, last seen, and every observation between.
Sends Issues to Agents for validation
When auto-trigger Agents are enabled for an Issue type, the configured Agent launches when a new Issue of that type appears. The Agent probes the underlying Object the same way an analyst would. Agents follow rules of engagement defined in Policies.
Depending on what it finds, the Agent will:
- Validate the Issue. Confirmed Issues move to the Validated tab with a green checkmark.
- Mark it as a false positive if the exposure cannot be confirmed.
- Close the Issue if it has already been remediated.
- Adjust severity up or down based on what the investigation reveals.
Issues that reach your triage queue have already been validated by an Agent. False-positive marks, closures, and severity changes are recorded with the Agent’s reasoning attached for audit.
For the configuration walkthrough, see Enable auto-running Issue Agents. For background on Agents and Policies, see AI Agents.
Day-to-day usage
Scans run on a recurring schedule, populating the Issues app with new validated Issues. Use the findings like so:
- Triage validated Issues in the Issues app. The Validated tab holds Issues an Agent has already confirmed. Filter by severity, family, environment, or tag, then resolve, accept, or escalate.
- Explore the Object inventory to understand what is in scope. Every domain, service, and web application Method finds lives here, with its relationships and history. New surfaces show up here first.
- Investigate live in Operations when an Issue warrants a deeper look. Method seeds the Operation with the Issue context and underlying assets, so you land in Operator ready to work.
Because the platform validates Issues as it discovers them, you spend your time on findings that already carry a confirmed risk.
Next steps
Once a Black Box External Assessment is running, the next stage of the Continuous Challenge maturity ladder is Continuous External Challenge. Method’s Targeting workflow takes validated Issues through PoC and exploitation under Rules of Engagement you control, surfacing not just confirmed risks but the proven paths an adversary could leverage.